
Root cause analysis and Pareto
Manual — Punch list (GQE) · chapter 11 of 13 · download the manual as PDF
Fixing the item solves the symptom. So that the deviation does not come back, the item page (and the NCR detail) has the Root cause analysis block, with three classic quality methods — 5 Whys, Ishikawa and FMEA — and, on the project page, the Pareto, which shows where the causes concentrate. It is what data center owners ask for in commissioning: the origin of every recorded failure, not only the fix.- Each method is a separate analysis of the same item: you can have all three side by side. Every analysis has the problem statement, the method lines, the root cause, the cause category (editable list, chapter 10), the corrective action and the preventive action.
- The analysis stays In progress while it is written; Conclude analysis checks the minimum of the method, records who concluded and locks editing; Reopen unlocks it. Delete removes the analysis from the page (the other methods stay).
- Whoever can edit the item — Edit right or being the responsible, with the item open — fills in the analysis; everyone else only reads. On the NCR, whoever answers or edits the NCR.
- The block opens expanded; Collapse / Expand on the right corner.
5 Whys
Section titled “5 Whys”The quickest method: it starts from the fact and asks why? until it reaches the cause that, once fixed, prevents recurrence — usually in five steps, sometimes fewer, sometimes more. Click 5 Whys and Start analysis; the problem statement comes filled with the item title.
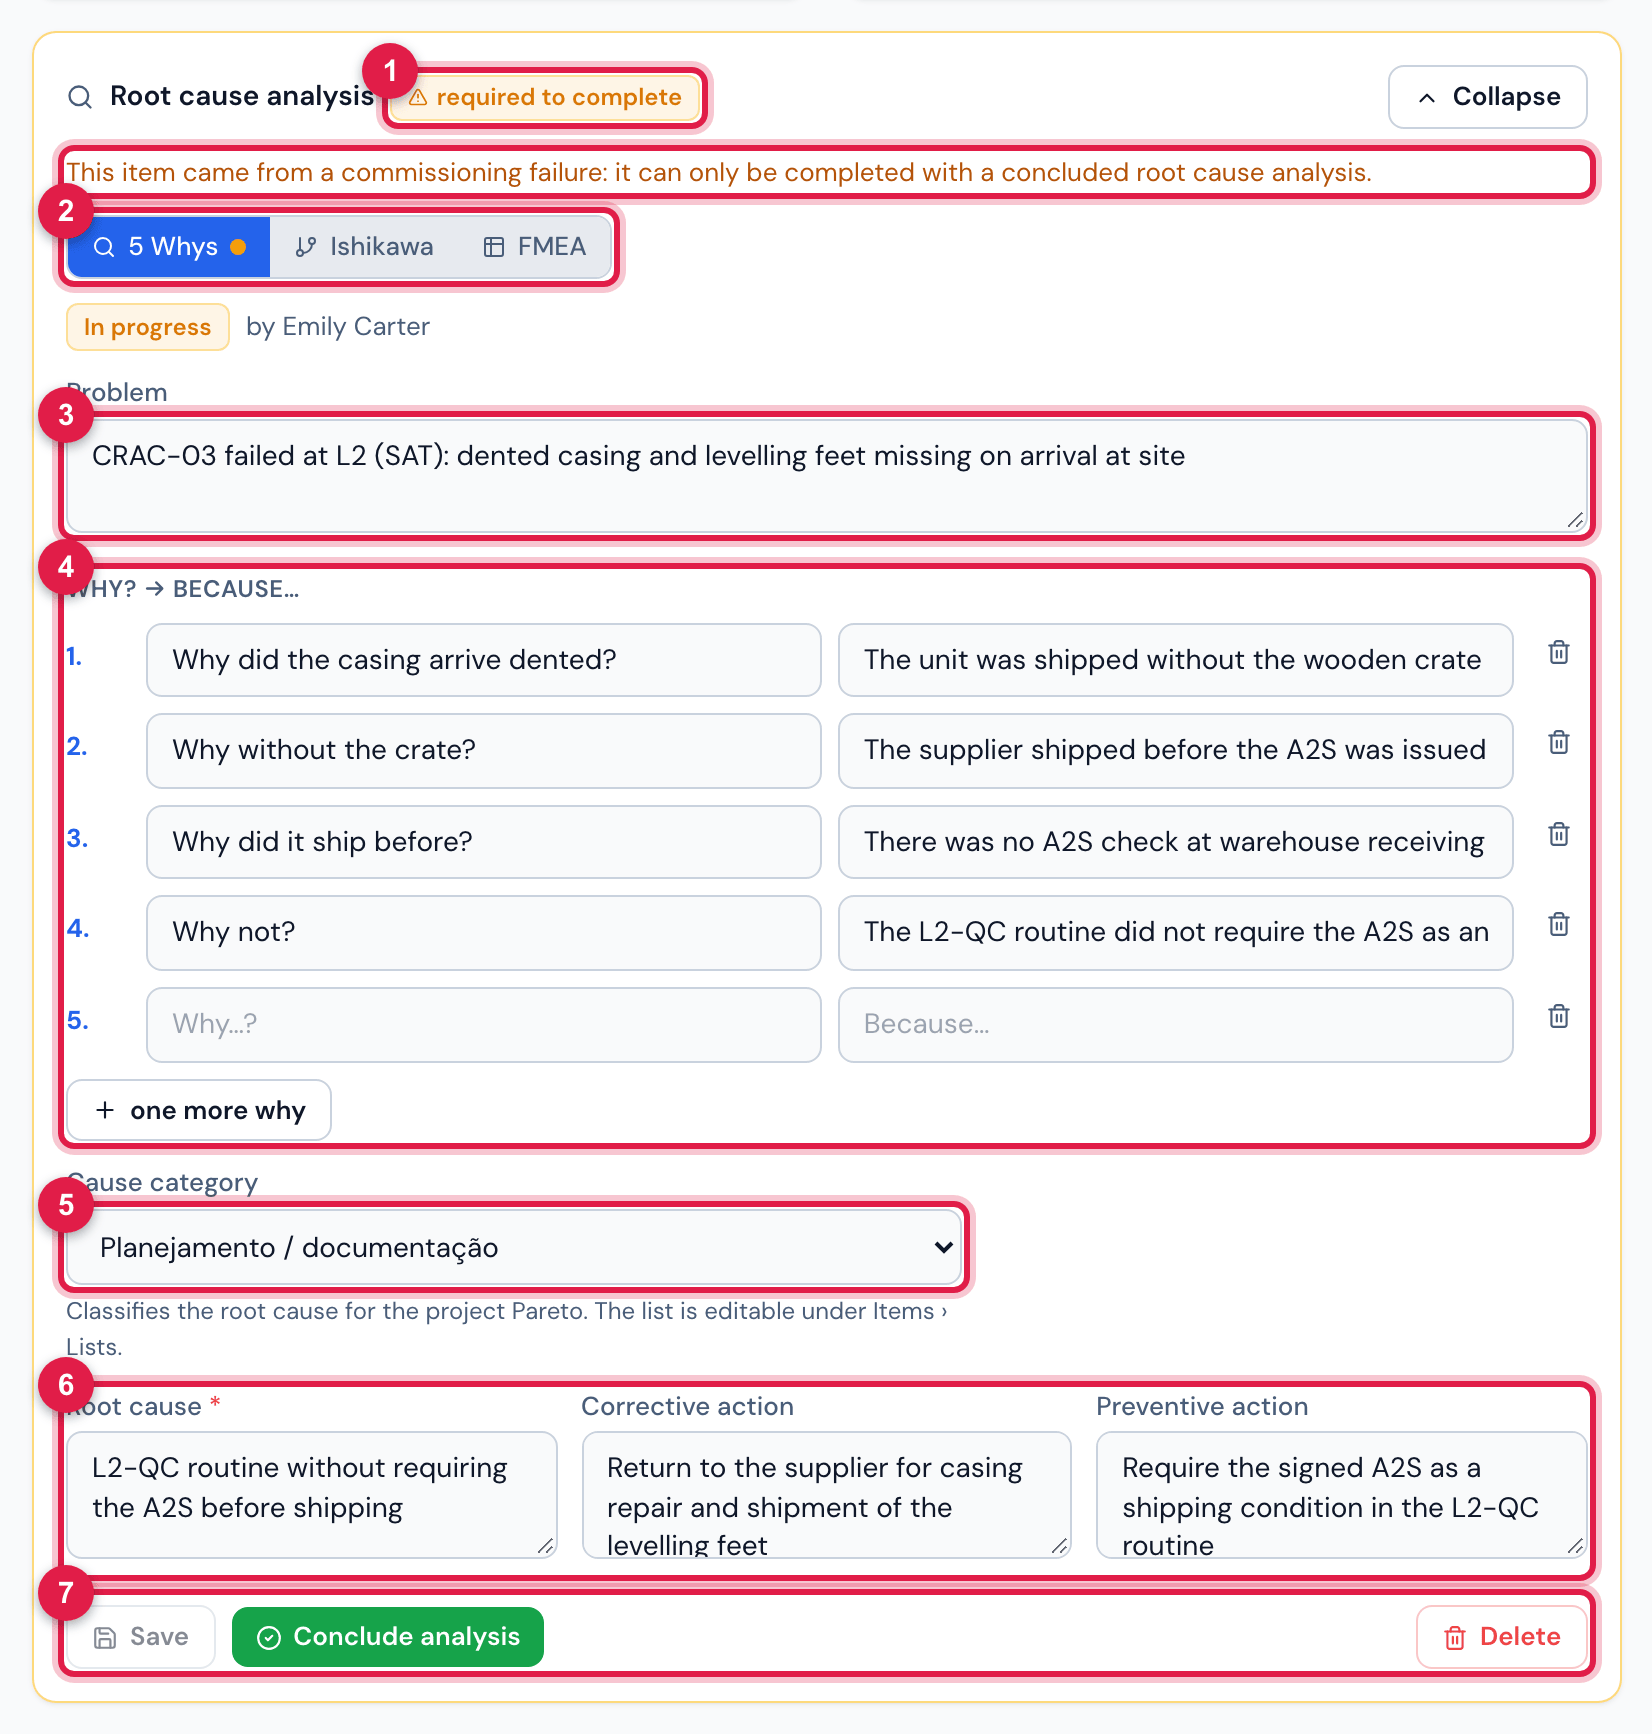
Figure 21. The Root cause analysis block of the item opened by the CRAC-03 failure at L2, in the 5 Whys method, still in progress.
- 1The required to complete badge and the warning: this item came from a commissioning failure and is only completed with a concluded analysis.
- 2The three methods; the dot next to the name says whether that method’s analysis is In progress (amber) or Concluded (green).
- 3The Problem: what happened, where and when — the fact, not the cause.
- 4The Why? → Because… chain: each line asks about the previous answer. one more why adds a line; the bin removes it.
- 5The Cause category (chapter 10, Lists) — it feeds the Pareto by cause.
- 6Root cause (required to conclude), Corrective action and Preventive action.
- 7Save, Conclude analysis and Delete. Once concluded, the analysis shows Reopen instead of Save/Conclude.
- Conclude requires the root cause written and at least one answered why; if missing, the message says which (Enter the root cause before concluding / Answer at least one why). Empty lines are not saved.
- Write the problem as an observable fact (“CRAC-03 failed at L2: dented casing and levelling feet missing”), not as a judgement. Stop when the answer points to something that can be changed — procedure, routine, training, design, supply.
Ishikawa (6M)
Section titled “Ishikawa (6M)”The cause-and-effect diagram organizes the possible causes in six bones — Method, Machine, Material, Manpower, Measurement and Environment — so the team does not forget any family of cause. It suits the analysis meeting, with several people raising hypotheses.
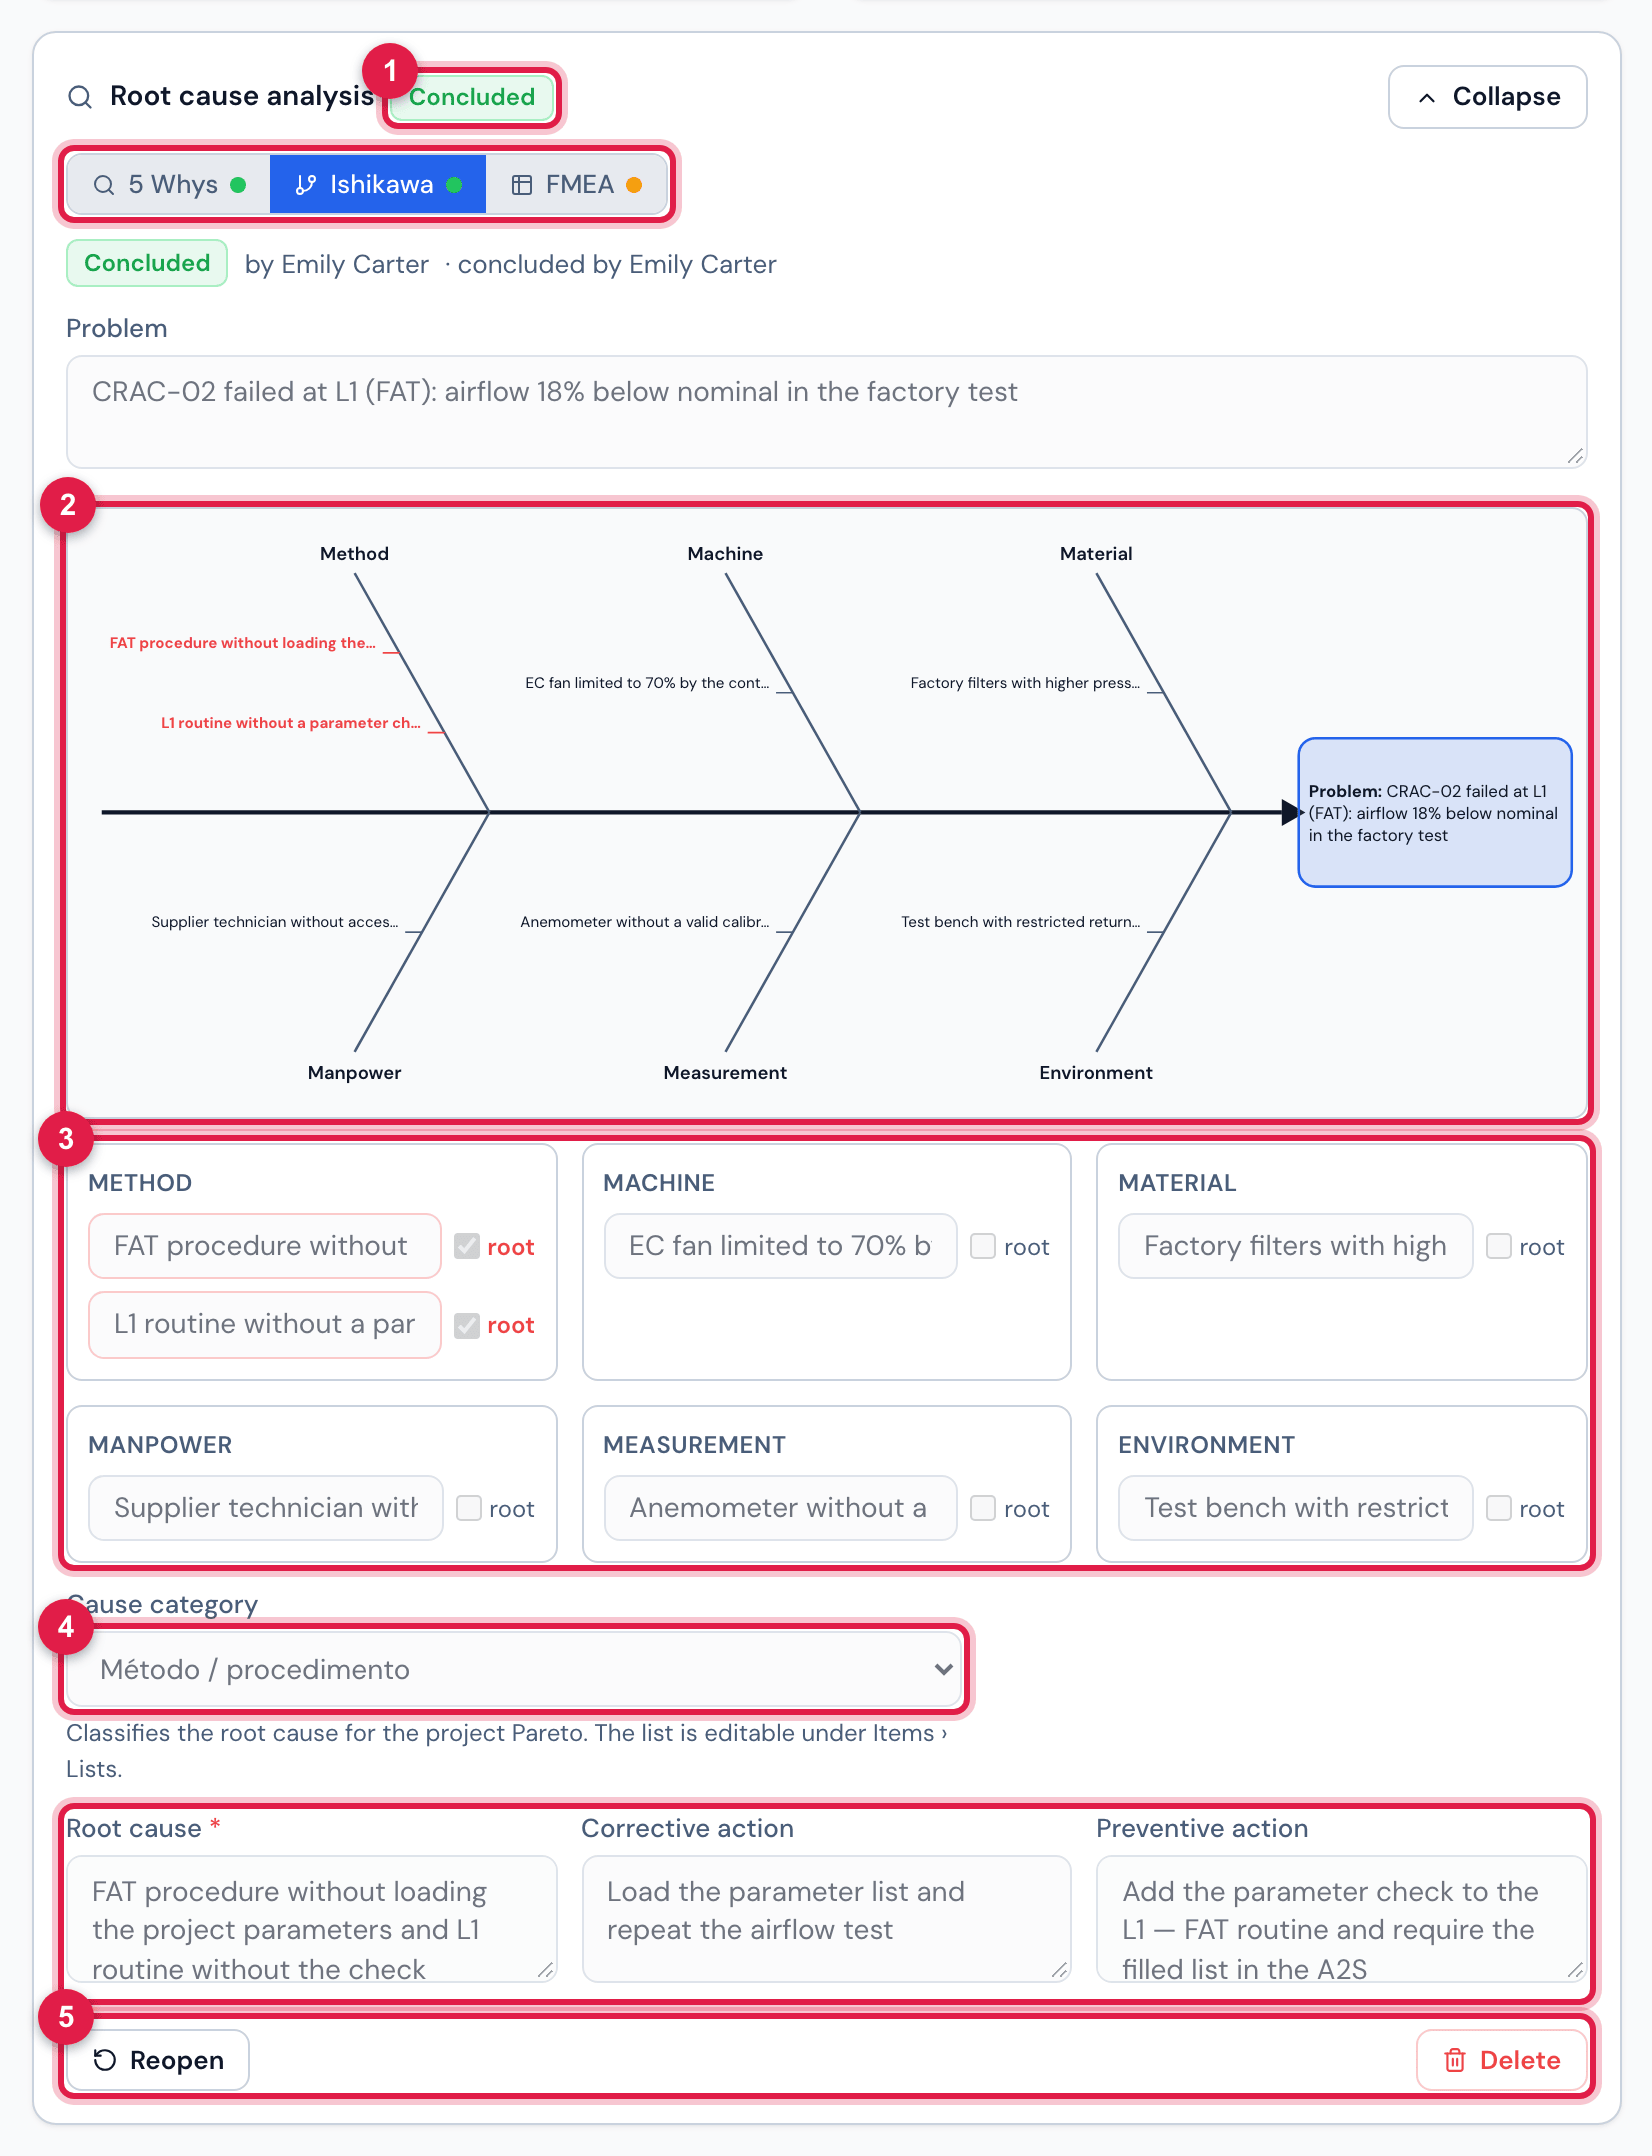
Figure 22. The item of the CRAC-02 failure at L1 in the Ishikawa method, already concluded: the diagram is drawn on the fly from the typed causes.
- 1The Concluded badge on the block title (some analysis is concluded: the obligation is met) and the green dots on the concluded methods.
- 2The fishbone diagram: three bones above, three below, the problem at the head; the causes marked as root come out in red.
- 3One box per bone: the + opens a cause line; the root checkbox marks the cause that explains the problem; the bin removes it.
- 4The Cause category and the closing fields, as in the 5 Whys.
- 5On a concluded analysis, only Reopen and Delete; the fields are locked.
- Conclude requires the root cause written and at least one cause marked as root in the diagram (Mark at least one root cause in the diagram). The root cause text summarizes the marked ones.
- Unmarked causes stay in the diagram as discarded hypotheses — they are part of the record.
- The diagram shows up to six causes per bone; the others stay only in the list.
The FMEA (Failure Mode and Effects Analysis) is the most complete analysis: it lists the possible failure modes of the equipment or installation, the effect of each one, the cause, the current controls and scores Severity, Occurrence and Detection from 1 to 10. The product RPN = S × O × D ranks what to treat first; the recommended action gets an owner and a due date and, once done, the line is re-evaluated (S′, O′, D′ → RPN′) to prove the risk went down.
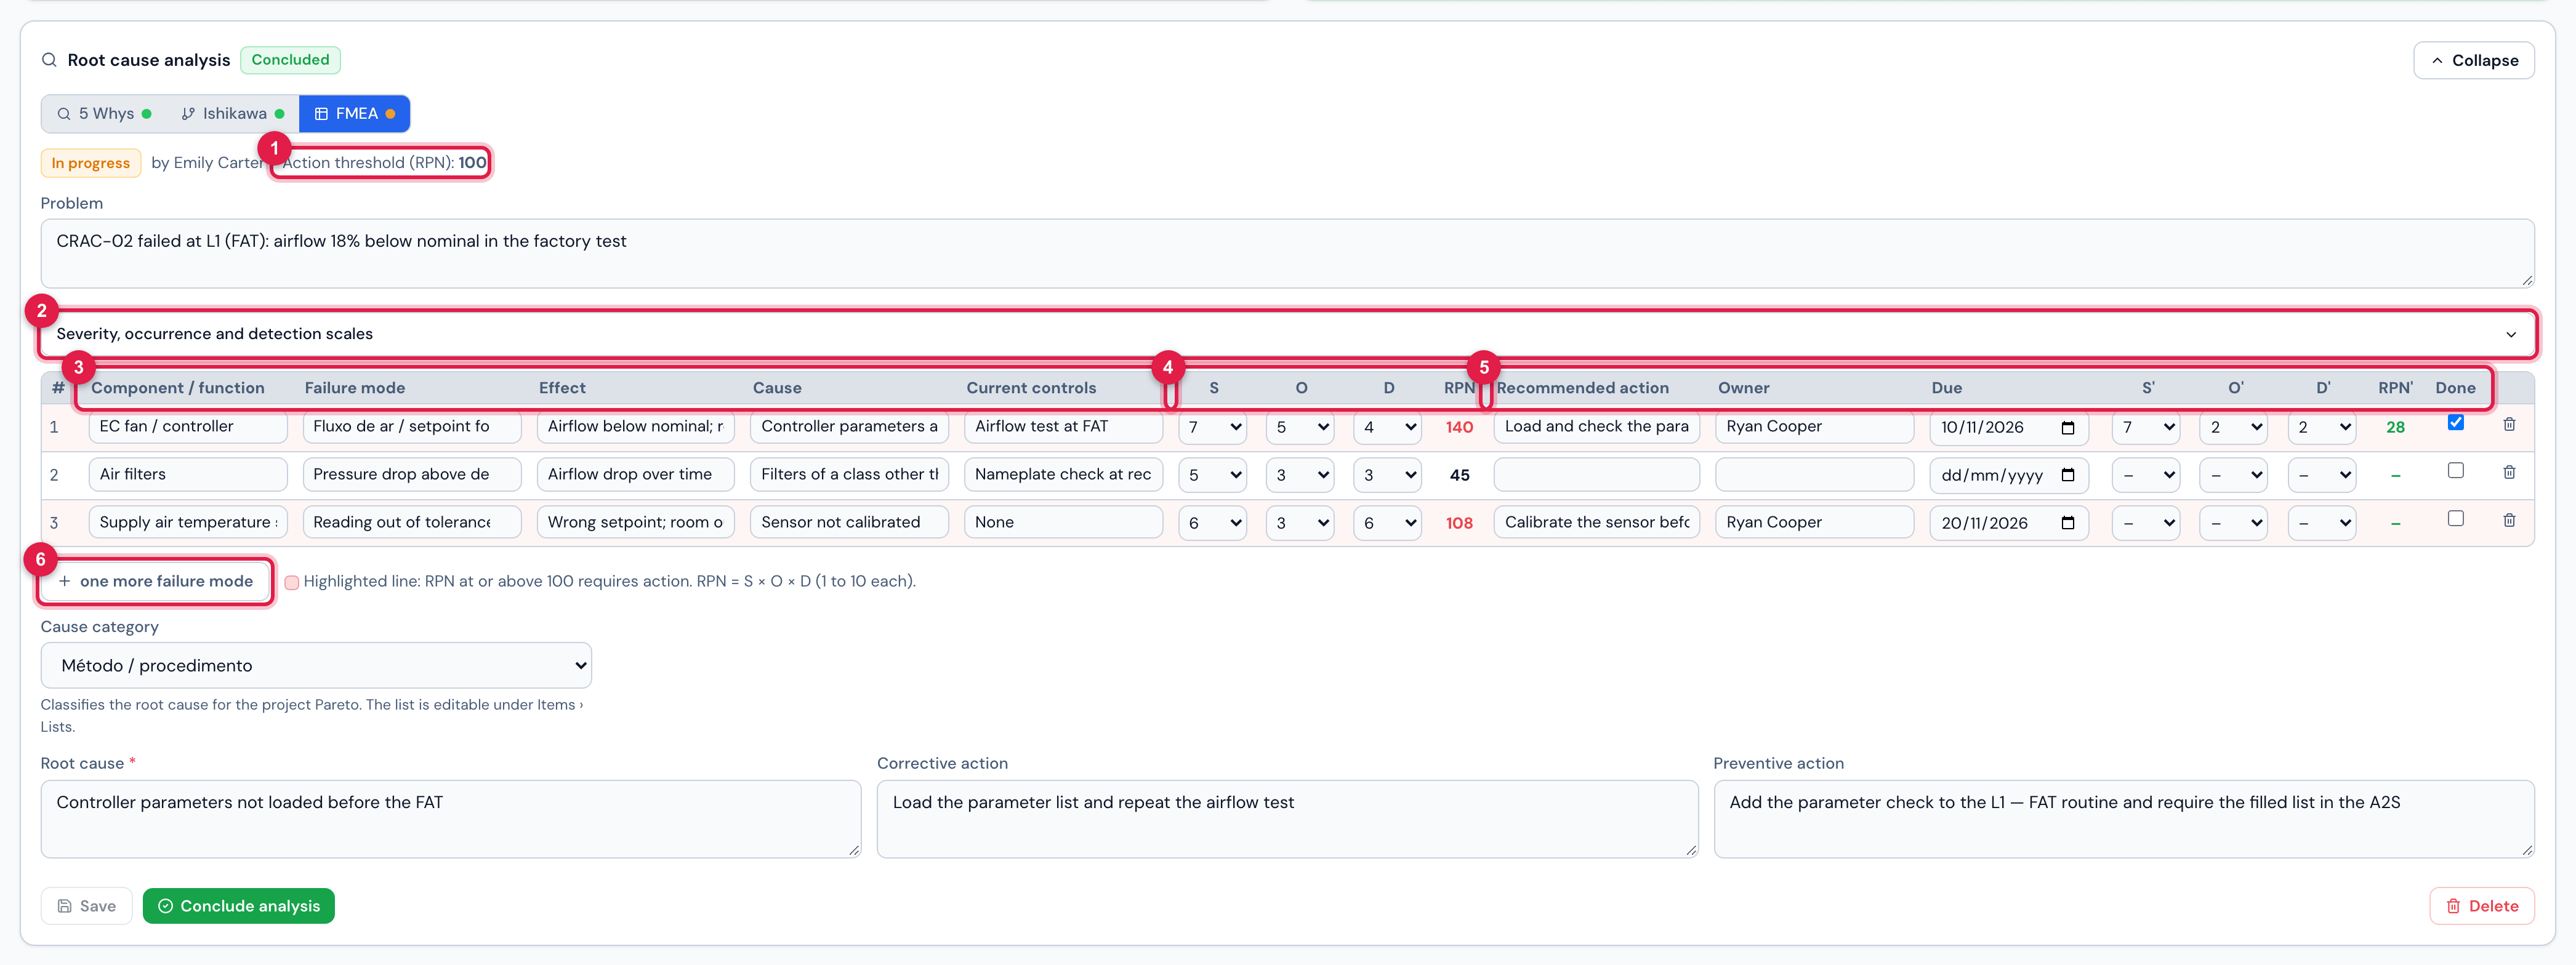
Figure 23. The FMEA method of the same item, in progress: one line per failure mode, with the computed RPN and the re-evaluation.
- 1The company’s Action threshold (RPN) (default 100): a line with RPN at or above it is highlighted in red and requires action.
- 2Severity, occurrence and detection scales: opens the table with the criterion of each score (the same text appears when hovering the chosen score).
- 3The line: Component / function, Failure mode (suggests the catalog while typing; accepts free text), Effect, Cause, Current controls.
- 4S, O, D and the computed RPN.
- 5Recommended action, Owner, Due date; after the action, S′ O′ D′ and the RPN′, plus the Done mark.
- 6one more failure mode adds a line; the line’s bin removes it.
- Conclude requires the root cause and at least one line with the three scores (Register at least one failure mode before concluding.). A blank score leaves the line’s RPN at zero.
- The project Pareto by RPN (below) adds up the RPN of each failure mode; a line already re-evaluated counts with its RPN′ (chapter 12).
- The scales, the failure mode catalog and the cause category are company lists (chapter 10): adjust the criteria to your procedure before using the FMEA at scale.
The project Pareto
Section titled “The project Pareto”With a project selected on the items screen (chapter 3), the Pareto card appears between the indicators and the list. It answers “where are the 80 %”: bars in descending order and the cumulative line, on a single % axis, with the 80 % reference; the vital few — the first bars, until crossing 80 % — are in the highlight colour.
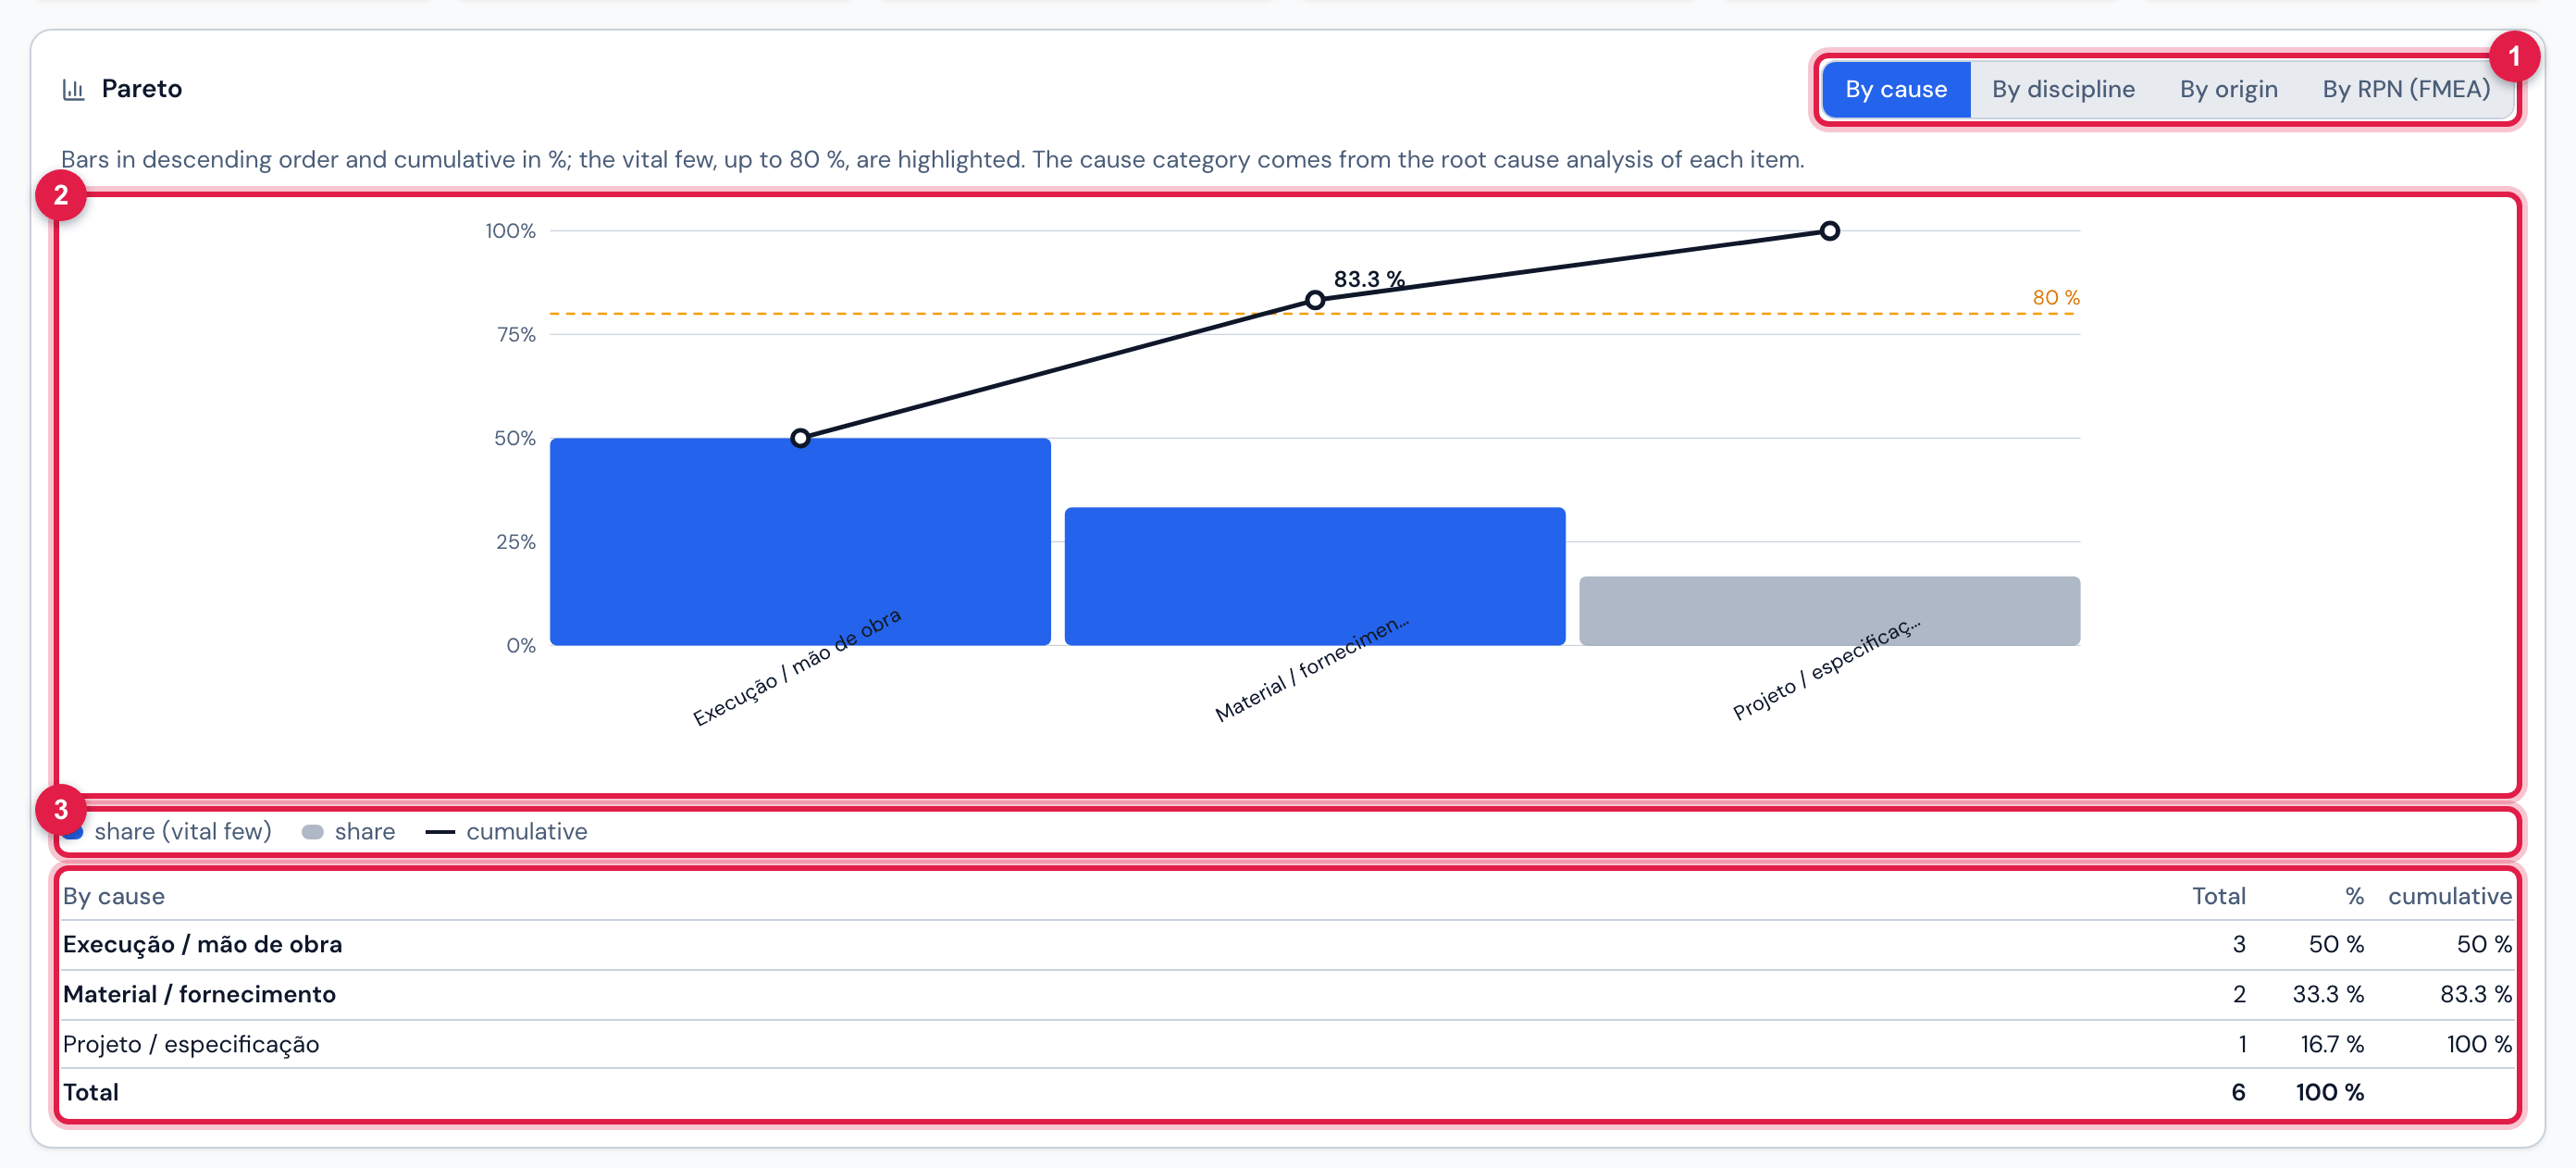
Figure 24. The project Pareto by cause: the root cause category of the analyses of each item.
- 1The dimension: By cause (root cause category), By discipline, By origin or By RPN (FMEA).
- 2The bars (share of each label) and the cumulative line; the dotted line marks the 80 % and the number is the point where the cumulative crosses it.
- 3The legend and the table with the same numbers: count, share and cumulative.
- Hover a bar to see the count, share and cumulative of that label.
- By cause uses the category of the most recent concluded analysis of each item (without a concluded one, the most recent that has a category). An item without analysis counts as No category — the more analyses, the more useful the chart.
- The Pareto follows the open only chip of the list: on, it counts only the open items; off, all items of the project. The other list filters do not affect it.
- By RPN adds up the RPN of each failure mode of the project FMEAs (one label per failure mode).
In the reports
Section titled “In the reports”- The detailed project PDF (chapter 9) brings the Pareto of causes section — by root cause category, by discipline and by origin, in bars — and, on each item, the Root cause analysis block with the text of each method (whys, causes per bone with the roots, FMEA lines with S, O, D, RPN, action and re-evaluation). The summary PDF does not include the analysis.
- The NCR form (FORM-QL-0003) prints the analyses as 12a. Root cause analysis (RCA), right below field 12.
- The commissioning asset dossier shows, under each item, the Root cause line with the concluded analyses and the category.
The RCA and FMEA lists
Section titled “The RCA and FMEA lists”In Items › Lists (chapter 10), besides the disciplines and origins, are the root cause analysis lists. H2O seeds a default set in each one; rename, reorder or deactivate as your procedure requires.
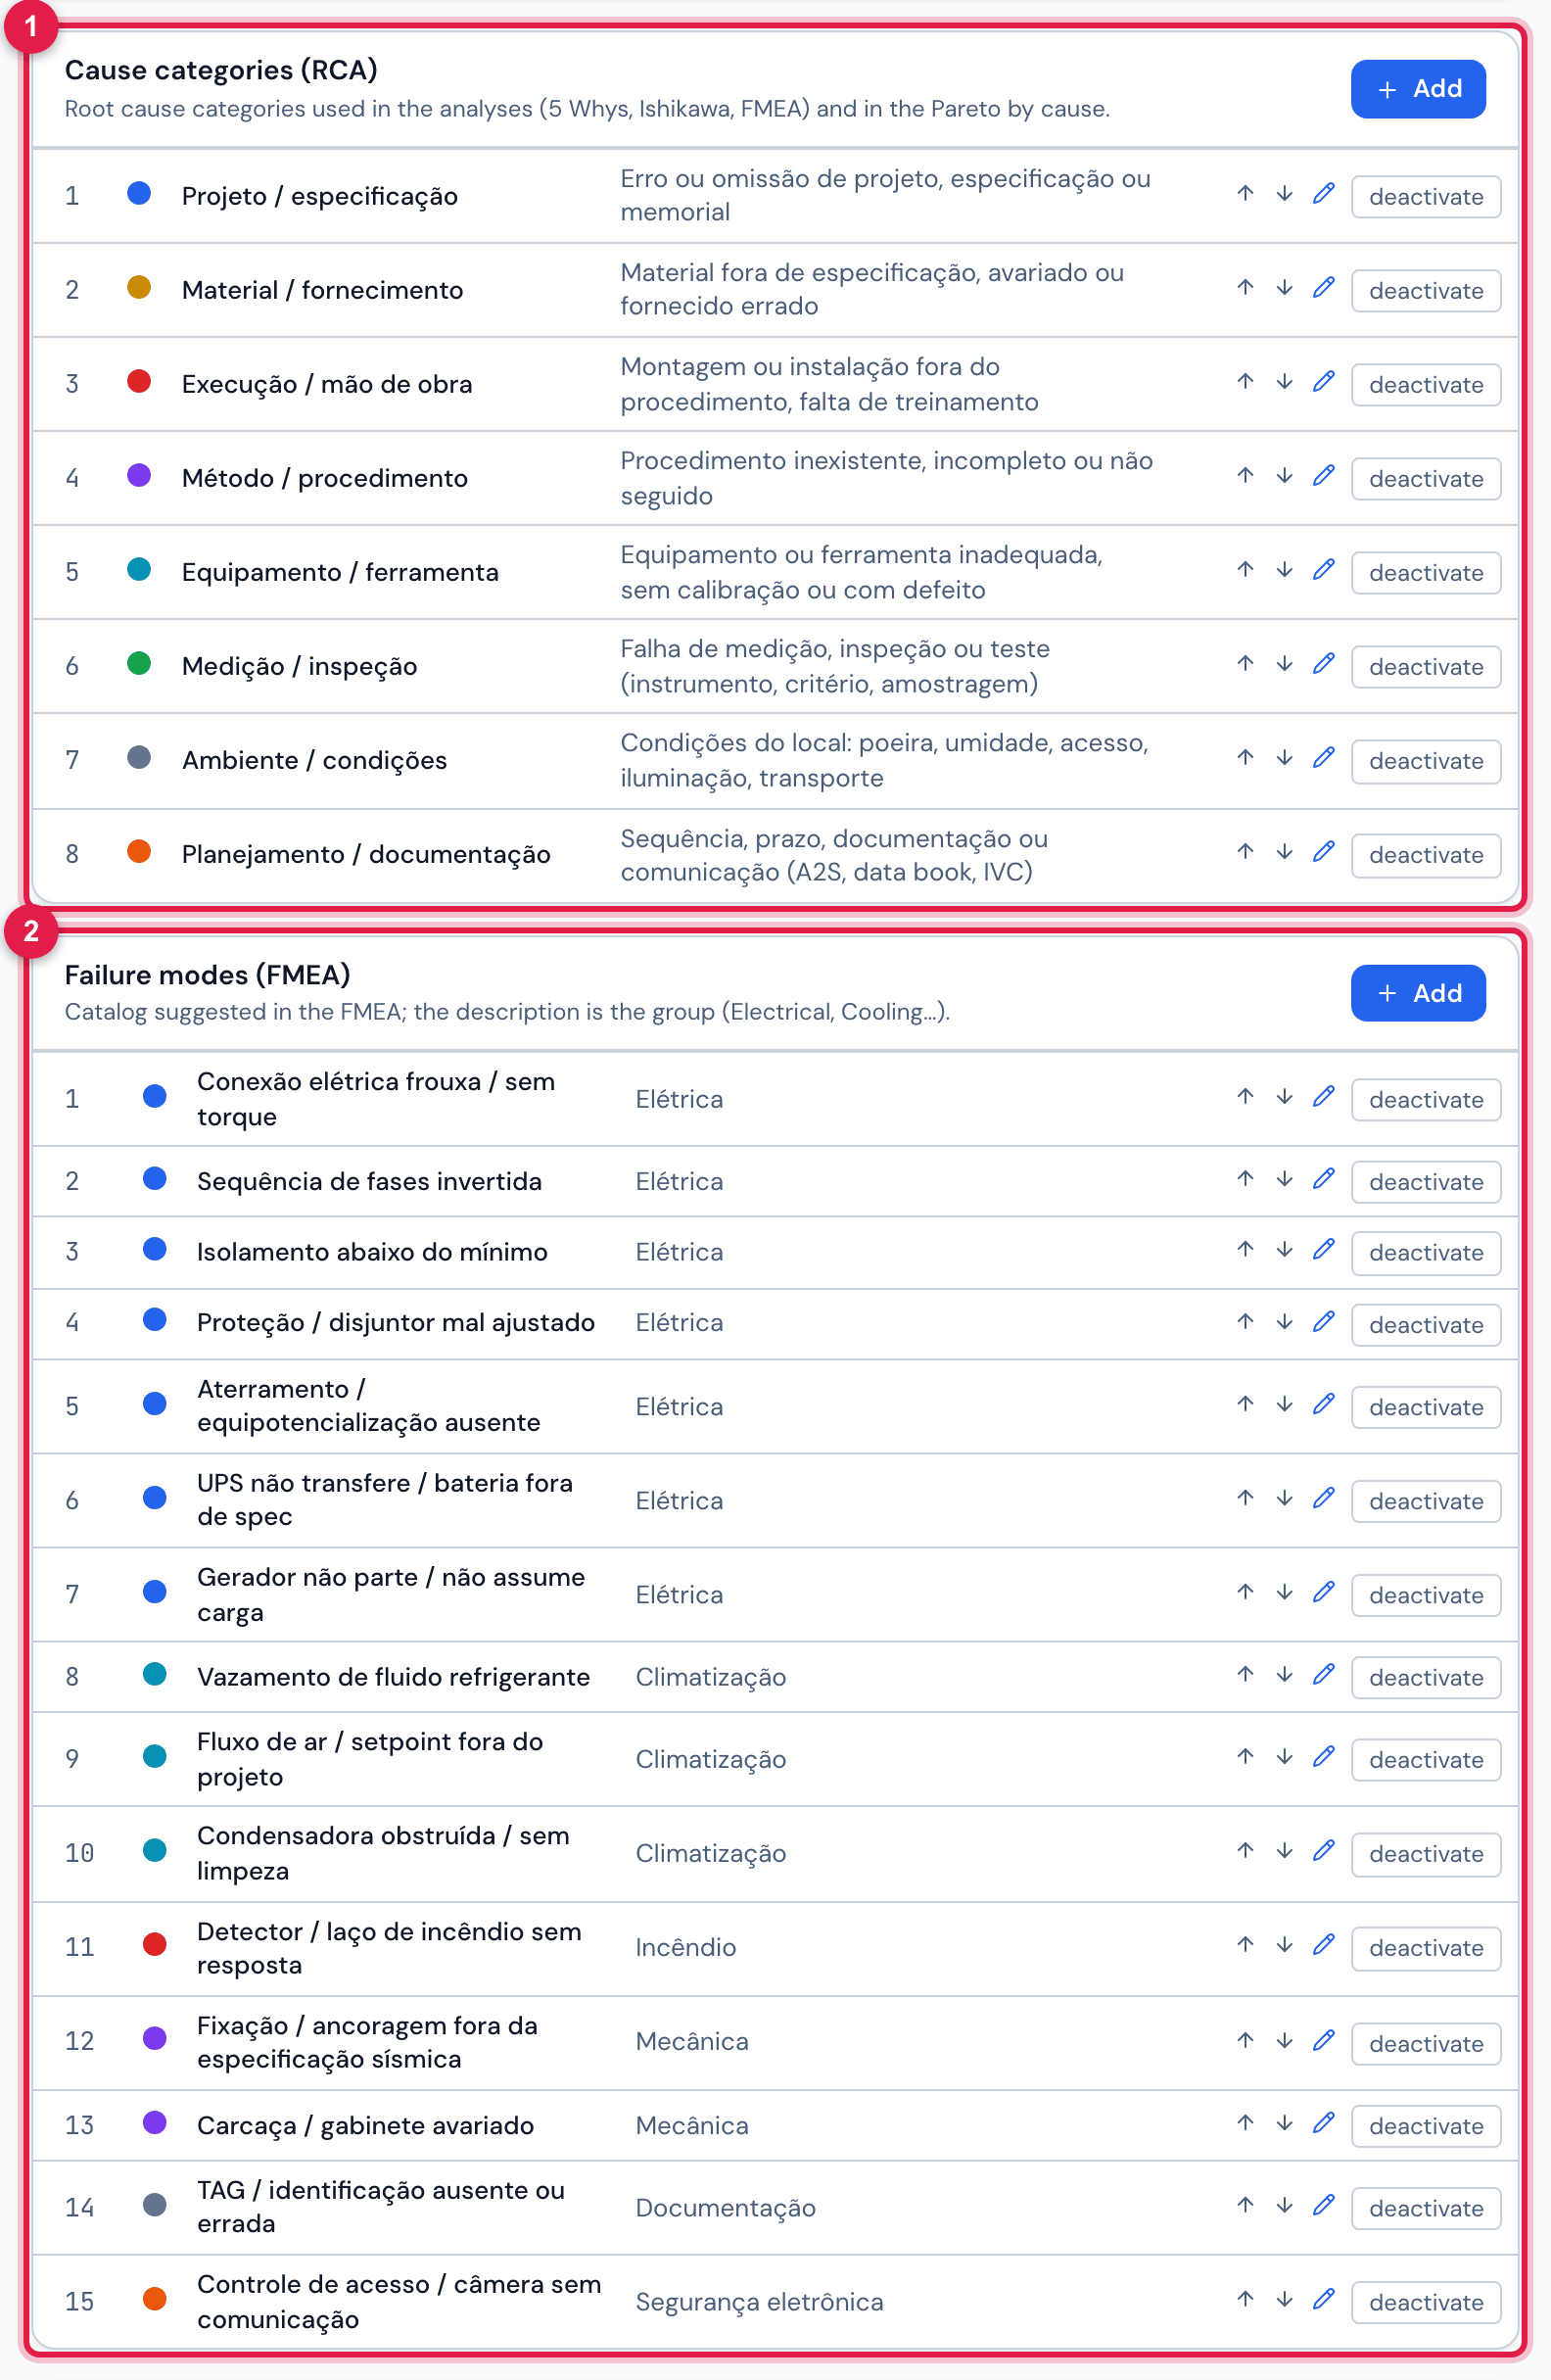
Figure 25. The Cause categories (RCA) and Failure modes (FMEA) lists in Items › Lists (the disciplines and origins sit above them on the screen, outside the crop).
- 1Cause categories (RCA): classify the root cause and feed the Pareto by cause.
- 2Failure modes (FMEA): the catalog suggested while typing the mode; the description is the group (Electrical, Cooling, Fire…).
Further down the same screen are the three FMEA scales — Severity, Occurrence and Detection —, one line per score from 1 to 10.
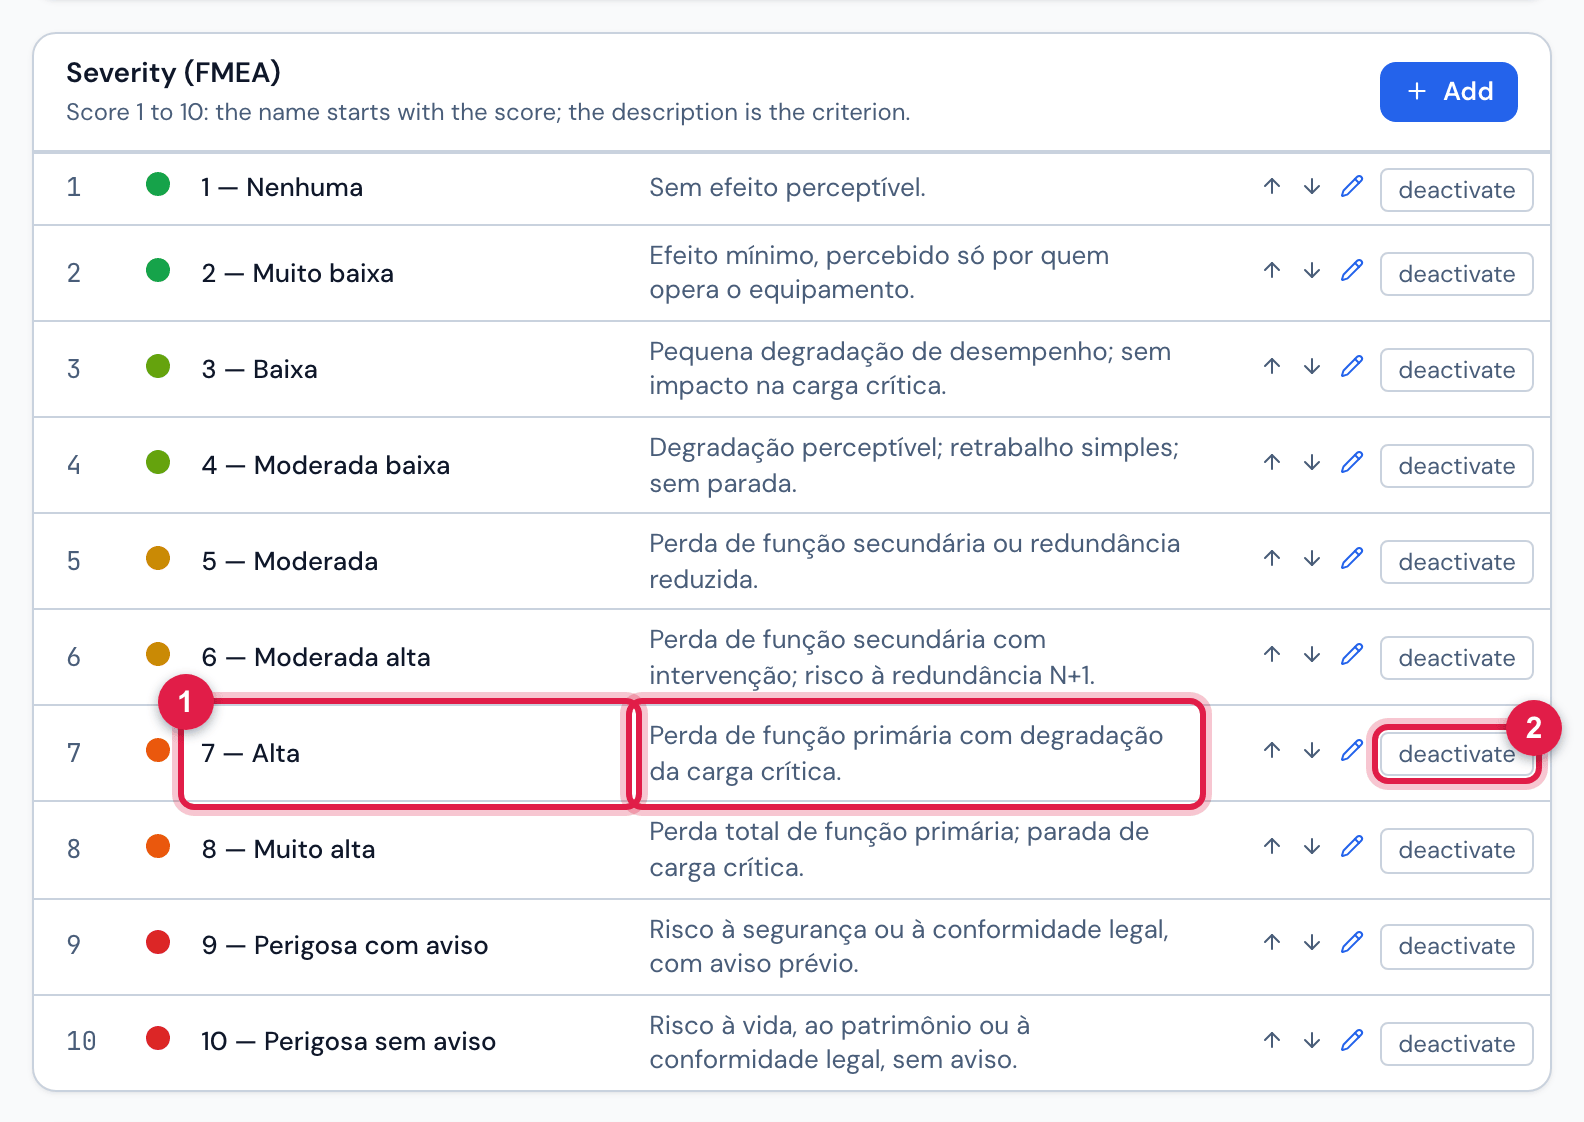
Figure 26. The Severity (FMEA) scale; Occurrence and Detection have the same shape.
- 1The name starts with the score (“7 — Alta”) and the description is the criterion the user sees when choosing the score in the FMEA.
- 2deactivate removes the score from the selector without deleting the analyses that used it; Add, rename and reorder work as for the disciplines.
Was this page helpful?
Thanks for the feedback!
Got it — we will improve this page.