
Statistics, tickets, documents and history
Manual — Assets · chapter 9 of 12
The four tabs below show what has happened to the asset: the reliability calculated from the tickets, the tickets themselves, the documents linked to it and the change history. They work the same way in all 16 asset types.Statistics
Section titled “Statistics”The Statistics tab calculates maintenance indicators from the tickets linked to the asset. The question mark of each card (How is it calculated?) explains the calculation.
| Indicator | How it is calculated |
|---|---|
| MTBF | Average of the intervals between the opening of consecutive corrective tickets. It needs at least 2 corrective tickets. |
| MTTR | Average time between opening and resolution of the corrective tickets. |
| MTTF | Operating time since the asset was registered, minus the downtime, divided by the number of failures. |
| Availability | Available time ÷ total time since registration. Above 95% is excellent; below 80% calls for attention. |
| Downtime | Sum of the repair times (opening → resolution) of the corrective tickets; open ones count up to now. |
Below the indicators are the Preventive and Corrective / Others counters and a timeline for each group: each dot is a ticket (filled = completed, hollow = in progress, dashed = scheduled for the future), with the TODAY mark when there is a ticket with a future date; hover to see the title, the status and the time, and click to open the ticket.
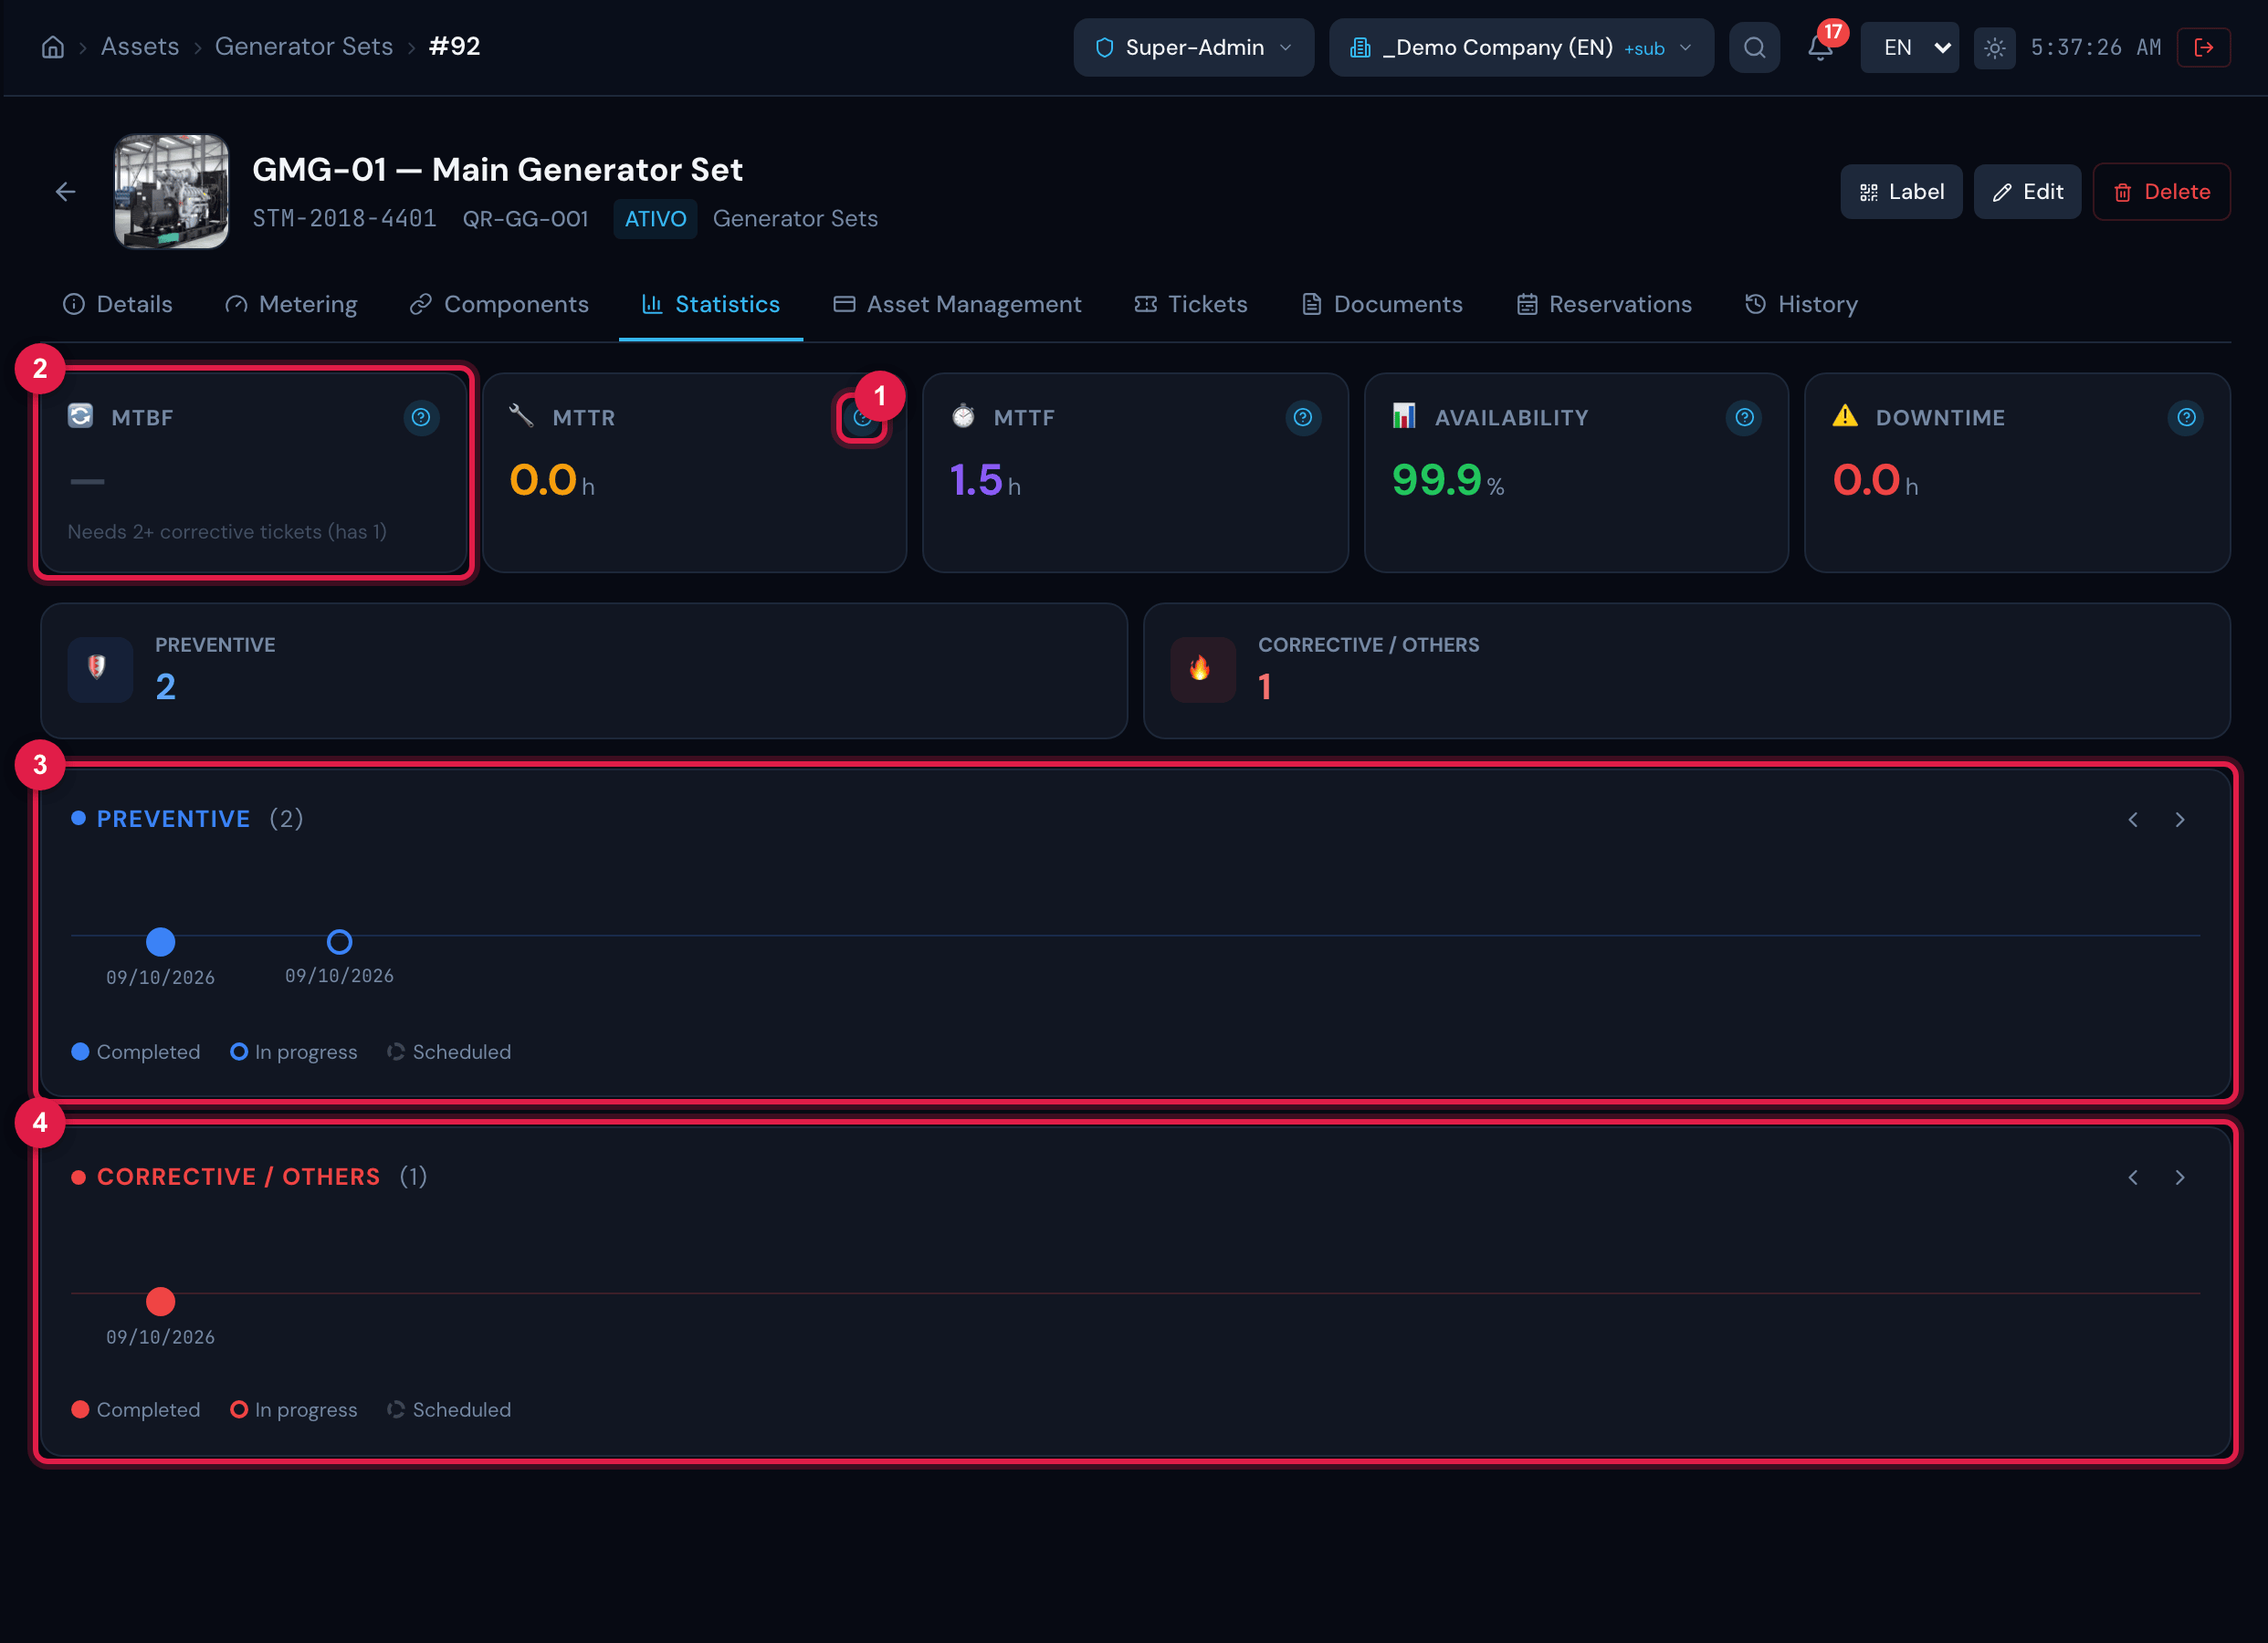
Figure 20. Statistics tab: the five indicators, the preventive and corrective counters and the two timelines.
- 1Indicator with the ? of How is it calculated?.
- 2Empty indicator with the reason (e.g. “Needs 2+ corrective tickets (has 1)”).
- 3Timeline of the preventive tickets (the TODAY mark only appears when there is a ticket with a future date).
- 4Timeline of the corrective tickets and other modalities.
Tickets
Section titled “Tickets”The Tickets tab lists the tickets linked to the asset, with the Total, Preventive, Corrective and Open cards, the All modalities and All statuses filters (only with the options found in the asset’s tickets) and the Clear button. Click a ticket to open it. To link an asset to a ticket, use the ticket itself.
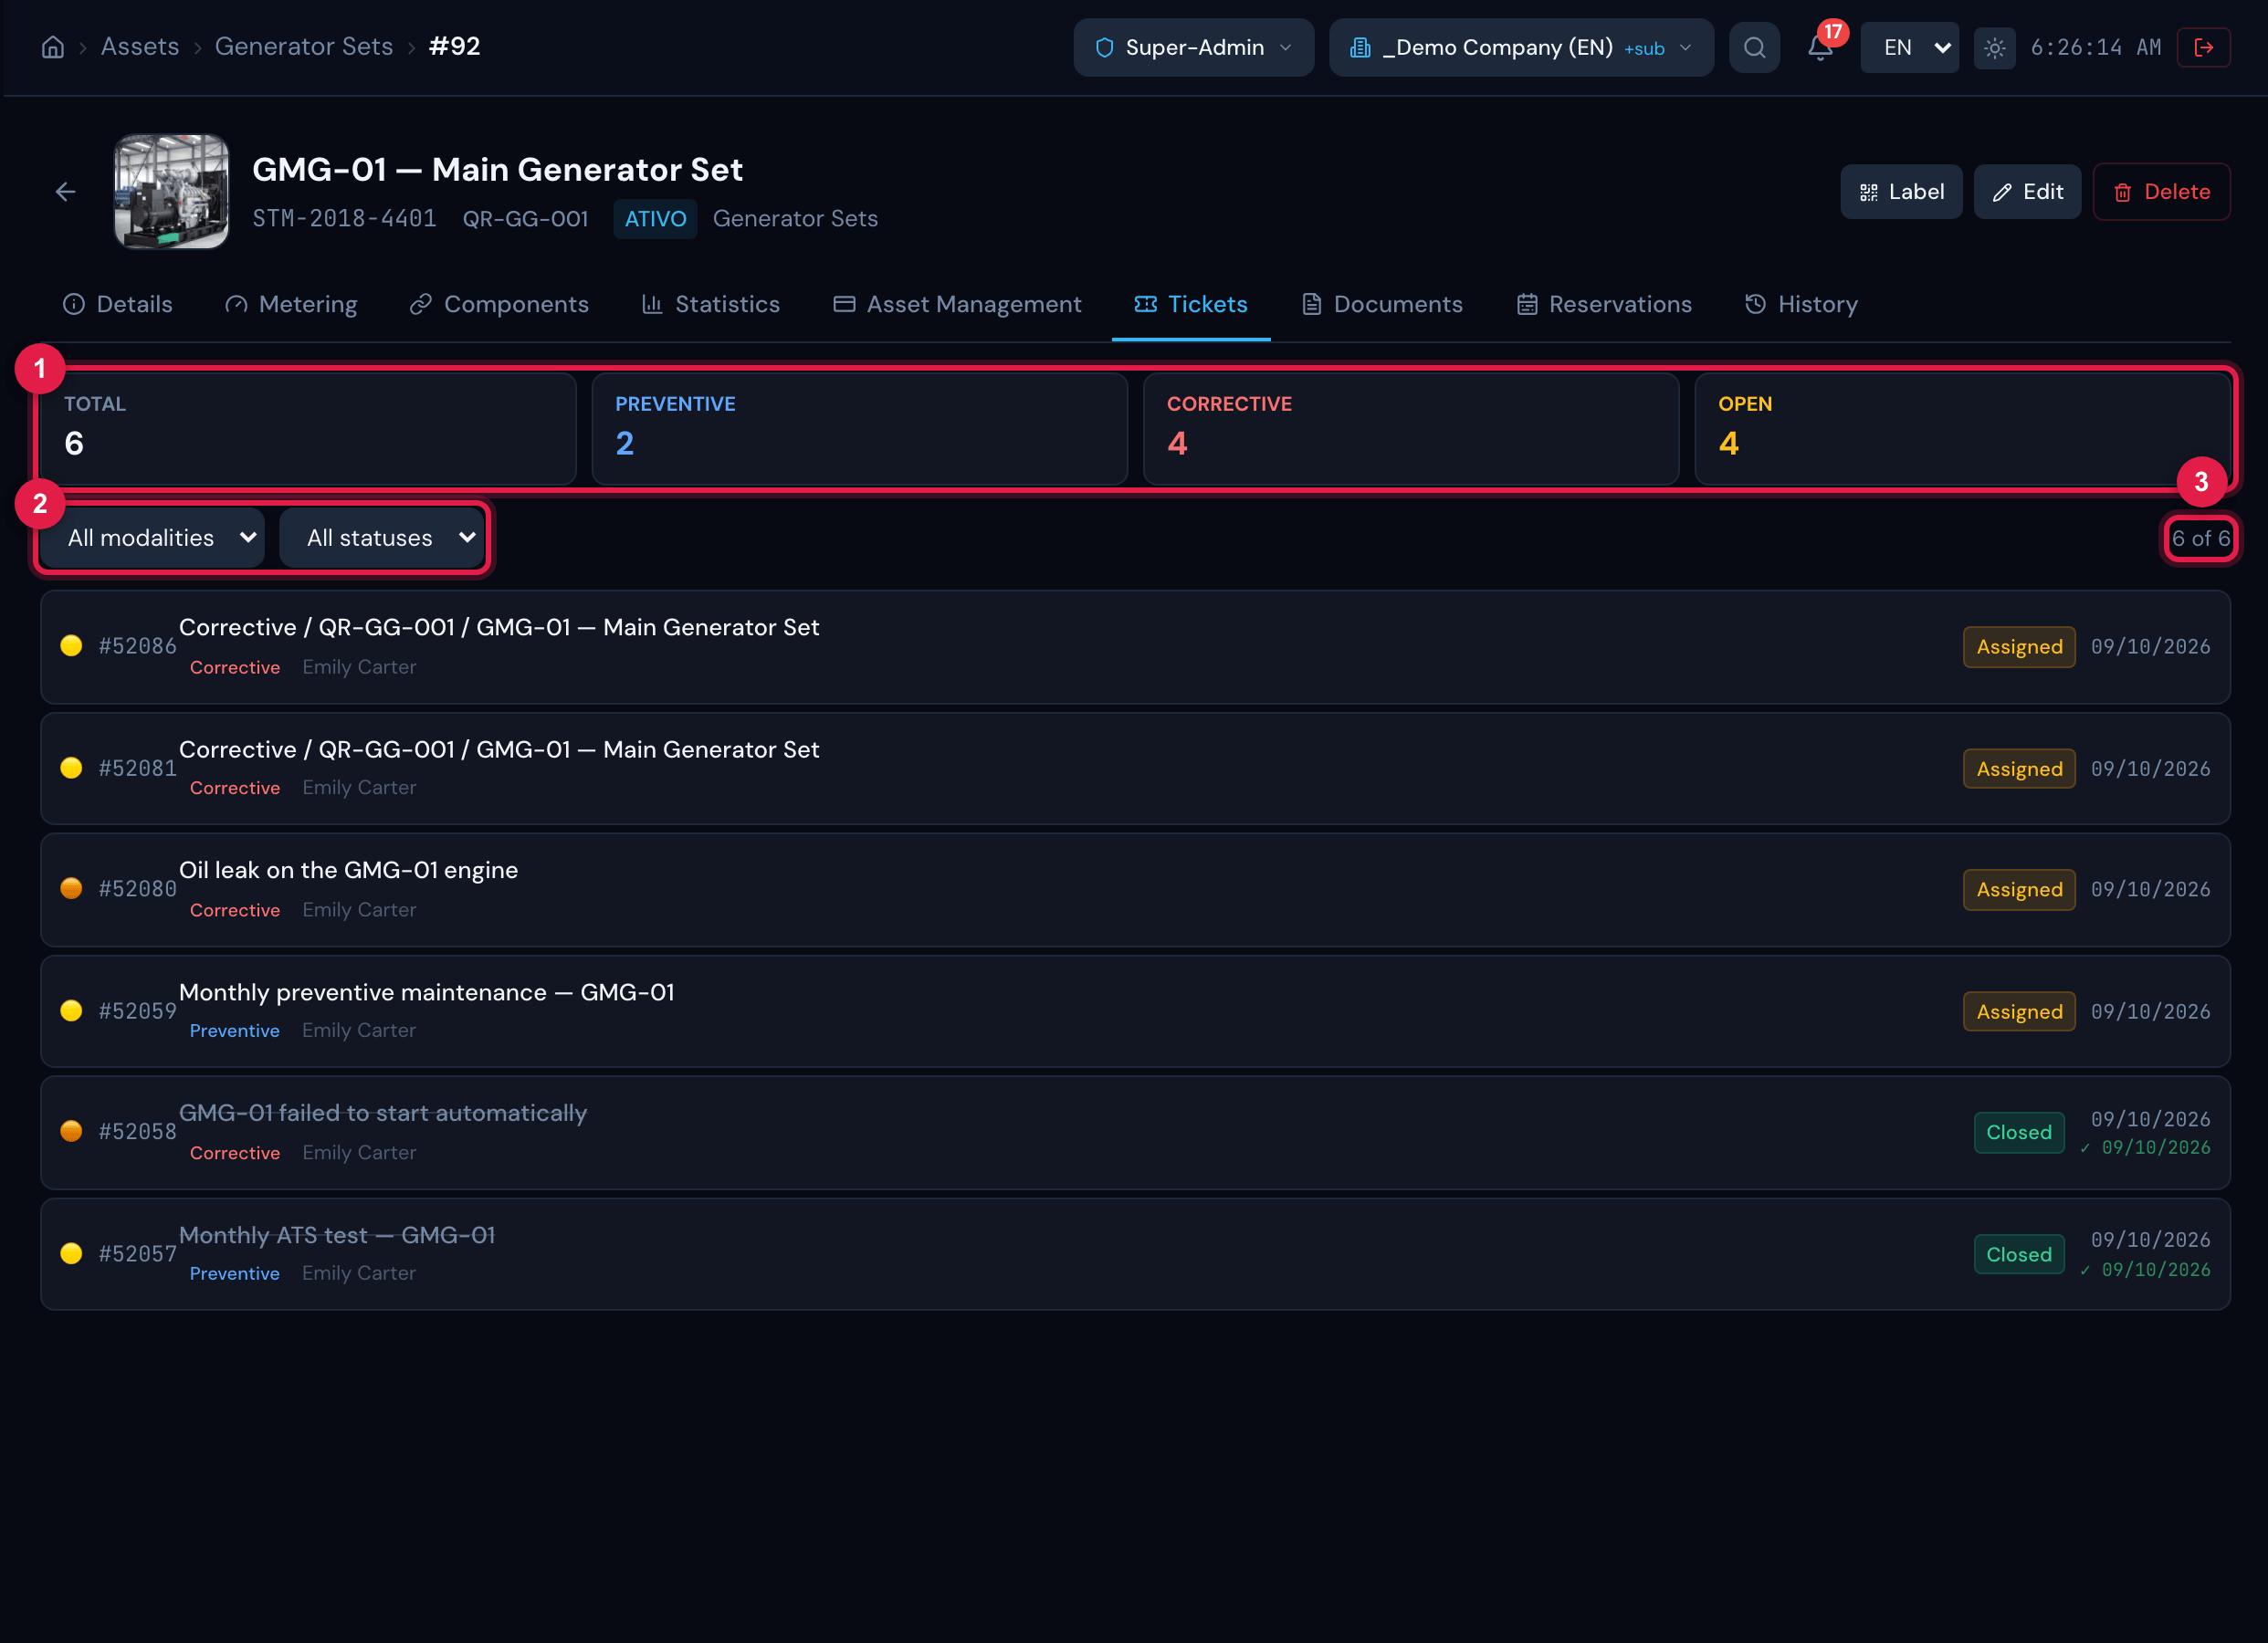
Figure 21. The asset’s Tickets tab: the four cards, the modality and status filters and the list of tickets with status, modality and priority.
- 1Total, Preventive, Corrective and Open cards.
- 2Modality and status filters.
- 3“N of M” count of the filter.
Documents
Section titled “Documents”The Documents tab gathers manuals, reports, invoices and photos linked to the asset. It uses the profile’s Documents right.
- Send file: choose the file (required), give it a Name (optional — without a name, the file name is kept) and a Comment and click Upload and link.
- Link existing: type at least 2 letters of the name or of the file, and click Link on the document already registered in H2O (those already linked appear as Already linked).
- On each document: the download icon (Download/Open), the pencil (changes name and comment) and Unlink, which removes the link without deleting the document.
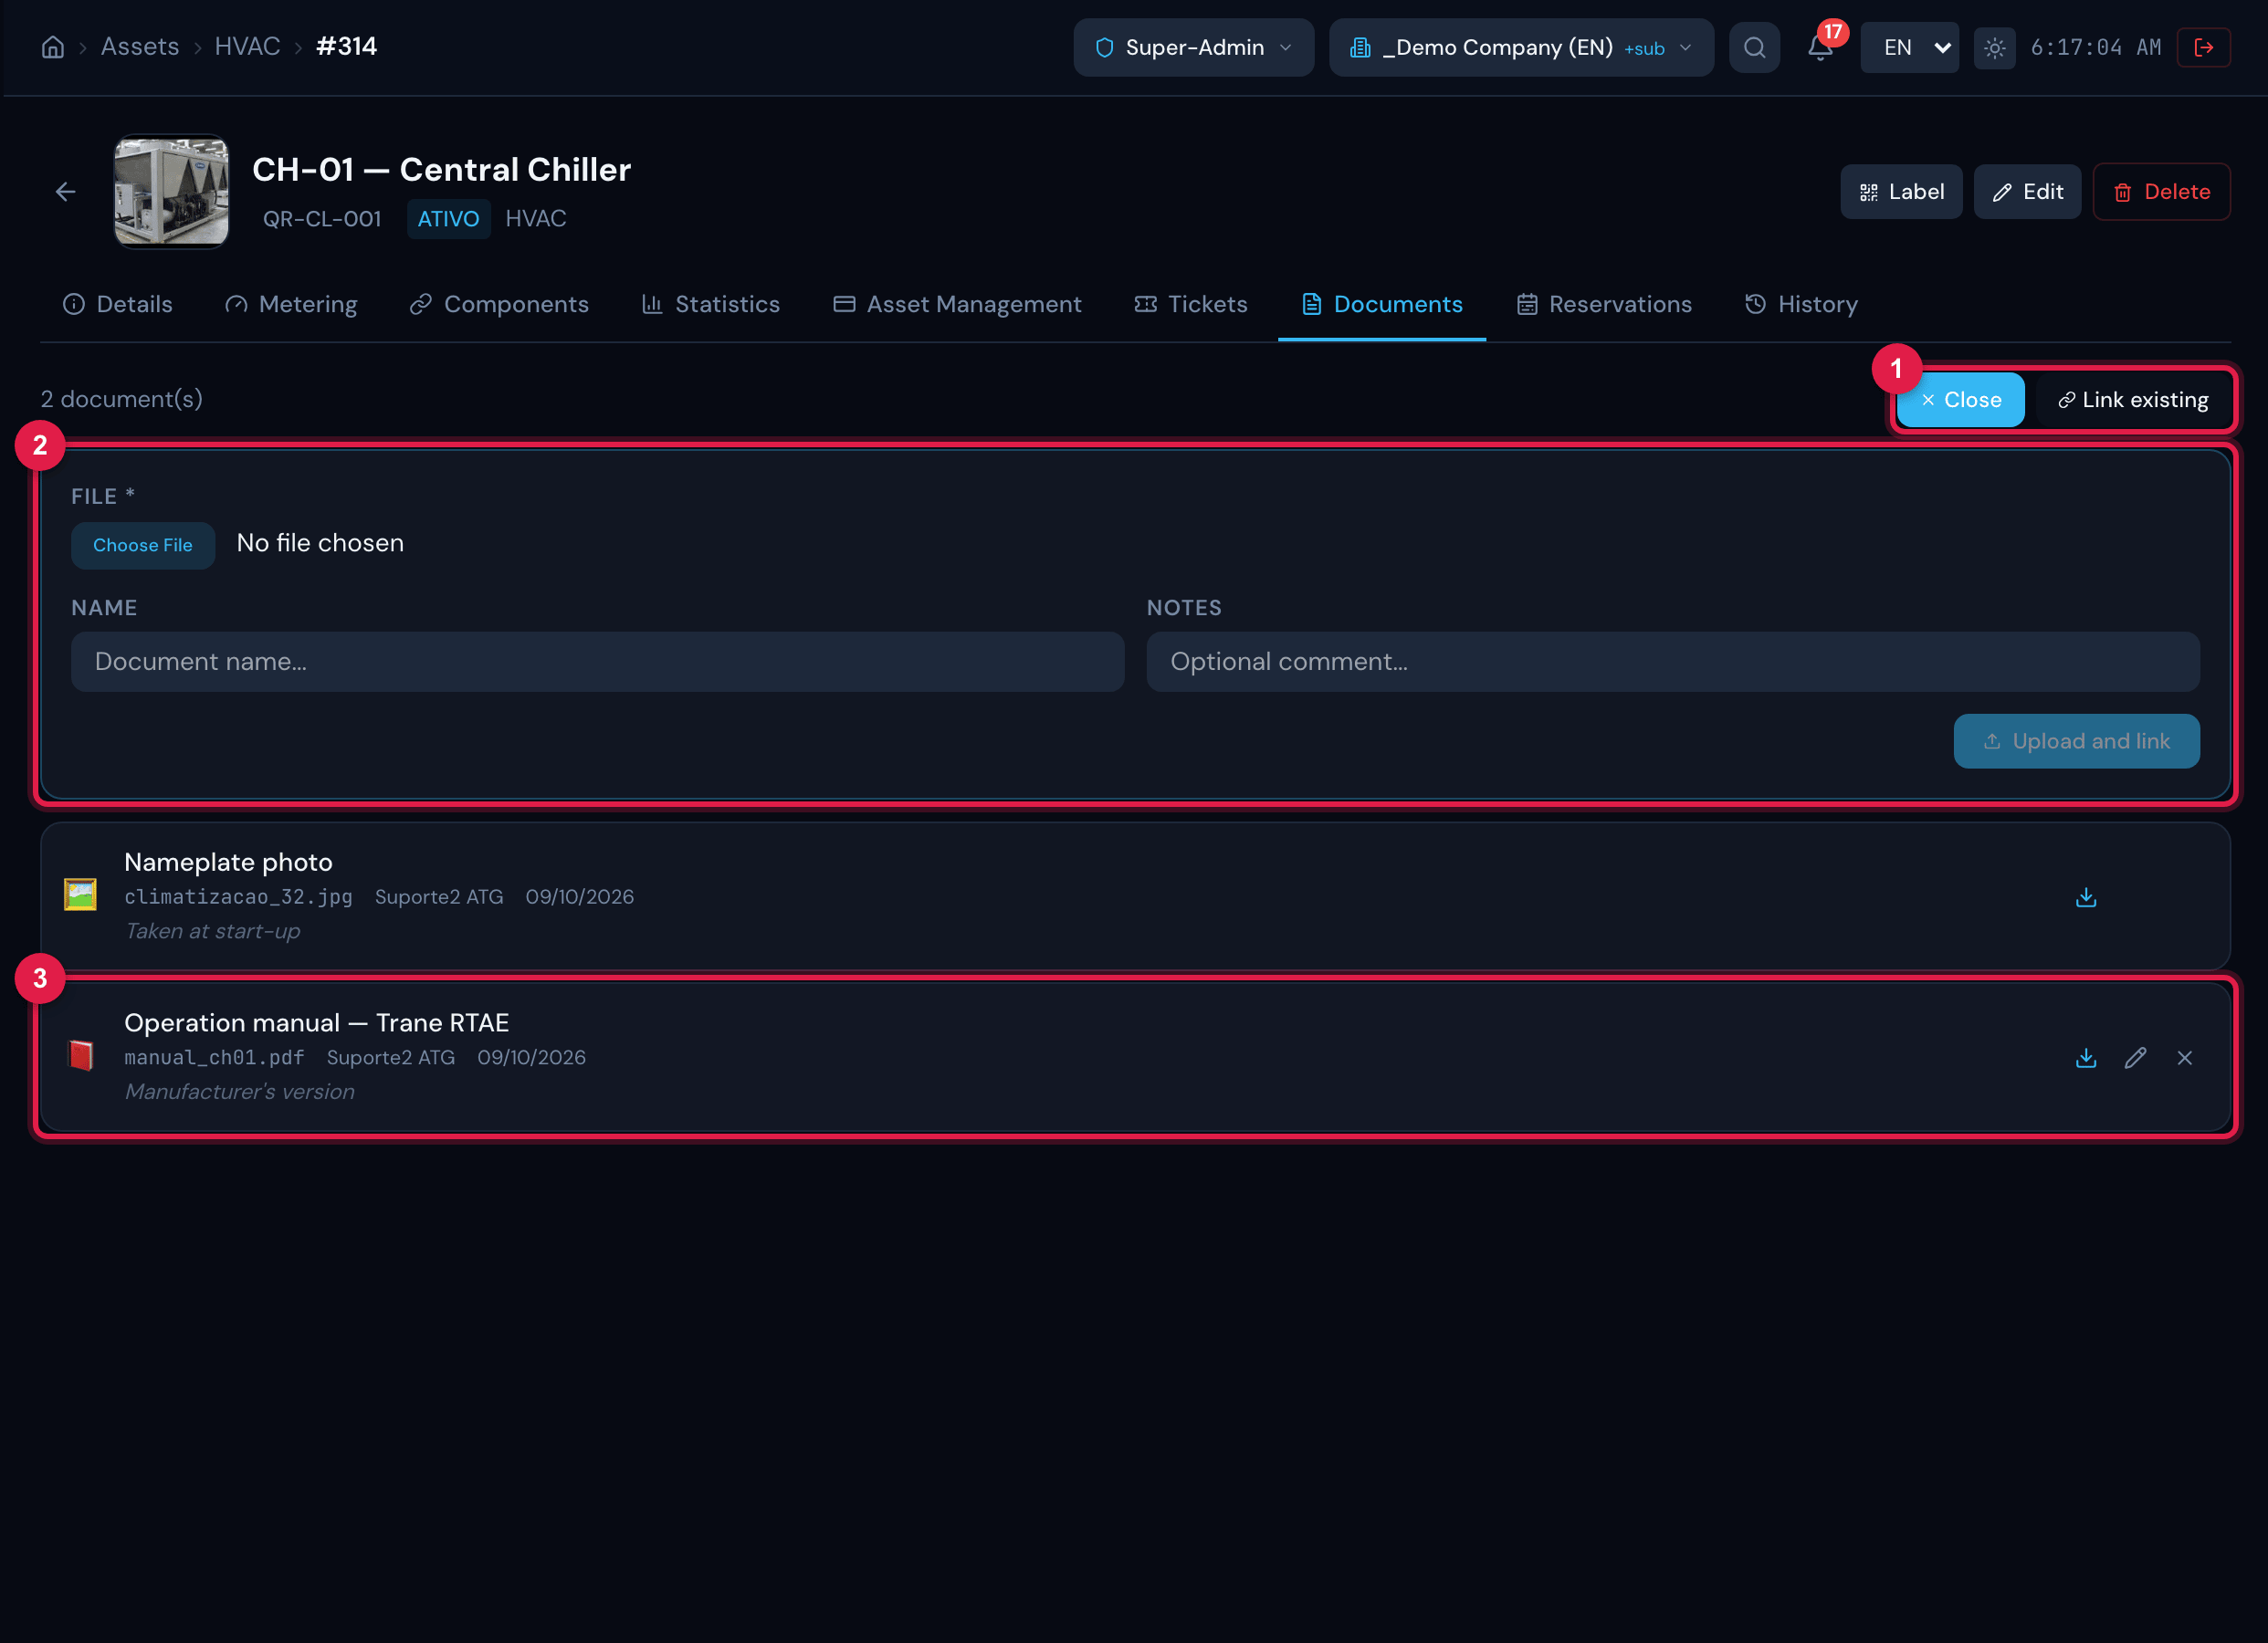
Figure 22. Documents tab of an HVAC unit with two linked documents and the Send file panel open.
- 1Send file (it becomes Close while the panel is open) and Link existing.
- 2Upload fields: file, name and comment; Upload and link.
- 3Linked document: download (edit and unlink appear on hover).
History
Section titled “History”The History tab shows the asset’s timeline: creation, each field changed (with the previous and the new value), photo changed, components added, changed and removed — with who did it and when.
Was this page helpful?
Thanks for the feedback!
Got it — we will improve this page.