
Project list
Manual — Projects · chapter 2 of 13
The Operations › Projects list shows the projects of the header site and of the sites below it. Deleted projects do not appear.State filters and Overdue
Section titled “State filters and Overdue”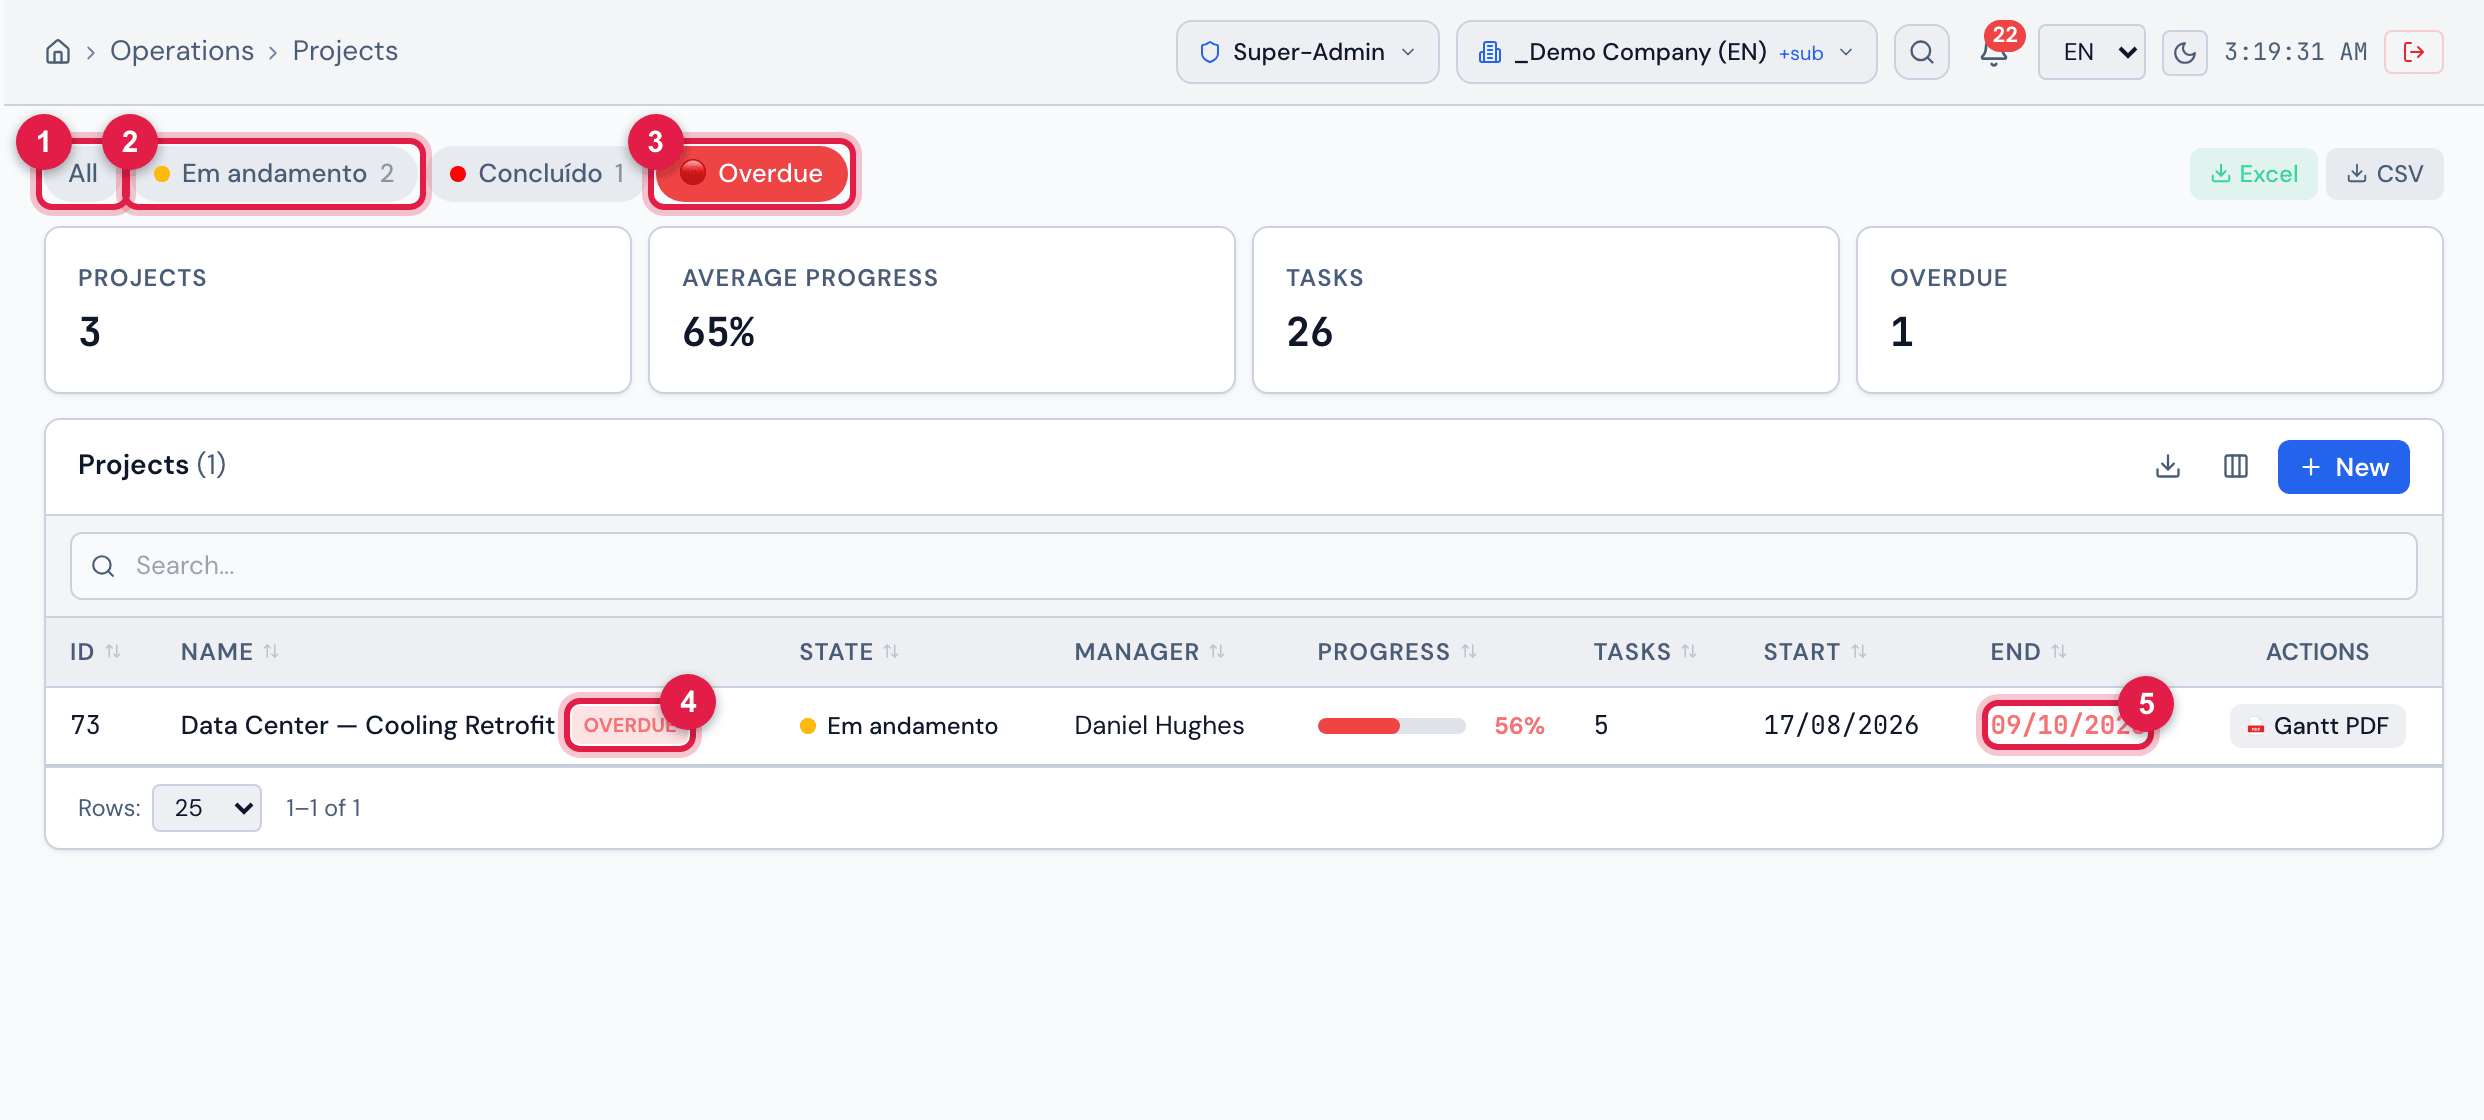
Figure 3. The list with the Overdue filter on: only Data Center — Cooling Retrofit remains, with planned end on 09/10/2026 and 56%, with the OVERDUE badge and the End date in red. In the example, the state filters are Em andamento (2) and Concluído (1) — names from the demo environment catalog, recorded in Portuguese.
- 1All — clears the filters.
- 2A state filter — the dot with the state color and, next to it, how many projects are in it.
- 3Overdue — the planned end has passed and progress has not reached 100% yet.
- 4OVERDUE badge next to the name.
- 5The End date in red.
- The filters are exclusive: choosing a state turns Overdue off, and vice versa.
- The numbers next to each state count the projects of the site, without the search.
- Projects without a state are grouped in the No state filter, which shows only them. Give every project a state: it is the state that organizes the list.
- “Overdue” in the list looks only at the date and the %: a project with an expired planned end and 95% remains overdue, even if its state is already a closing one. Keep the % up to date or close with 100% (chapter 4).
Cards and columns
Section titled “Cards and columns”| Card | What it adds up |
|---|---|
| Projects | how many projects there are in the site (and below). |
| Average Progress | the average % of the projects. |
| Tasks | the total number of tasks of these projects. |
| Overdue | how many are overdue (in red when there is any). |
| Column | What it shows |
|---|---|
| ID | the project number. |
| Name | the name, with the OVERDUE badge when that is the case. |
| State | the state, with its color. |
| Manager | the project manager. |
| Progress | the bar and the %: green at 100%, red if overdue, amber below 50%. The % follows the project’s progress mode (chapter 3). |
| Tasks | how many tasks the project has. |
| Site | the project site — hidden at first; turn it on in Columns. |
| Start / End | the planned dates. |
- The search looks in the name, the description and the comment of the project.
- Click the title of any column — ID, Name, State, Manager, Progress, Tasks, Start or End — to sort; sorting applies to all projects, not only the open page.
- In Columns you show or hide columns; the choice is kept in the browser.
Export and Gantt PDF
Section titled “Export and Gantt PDF”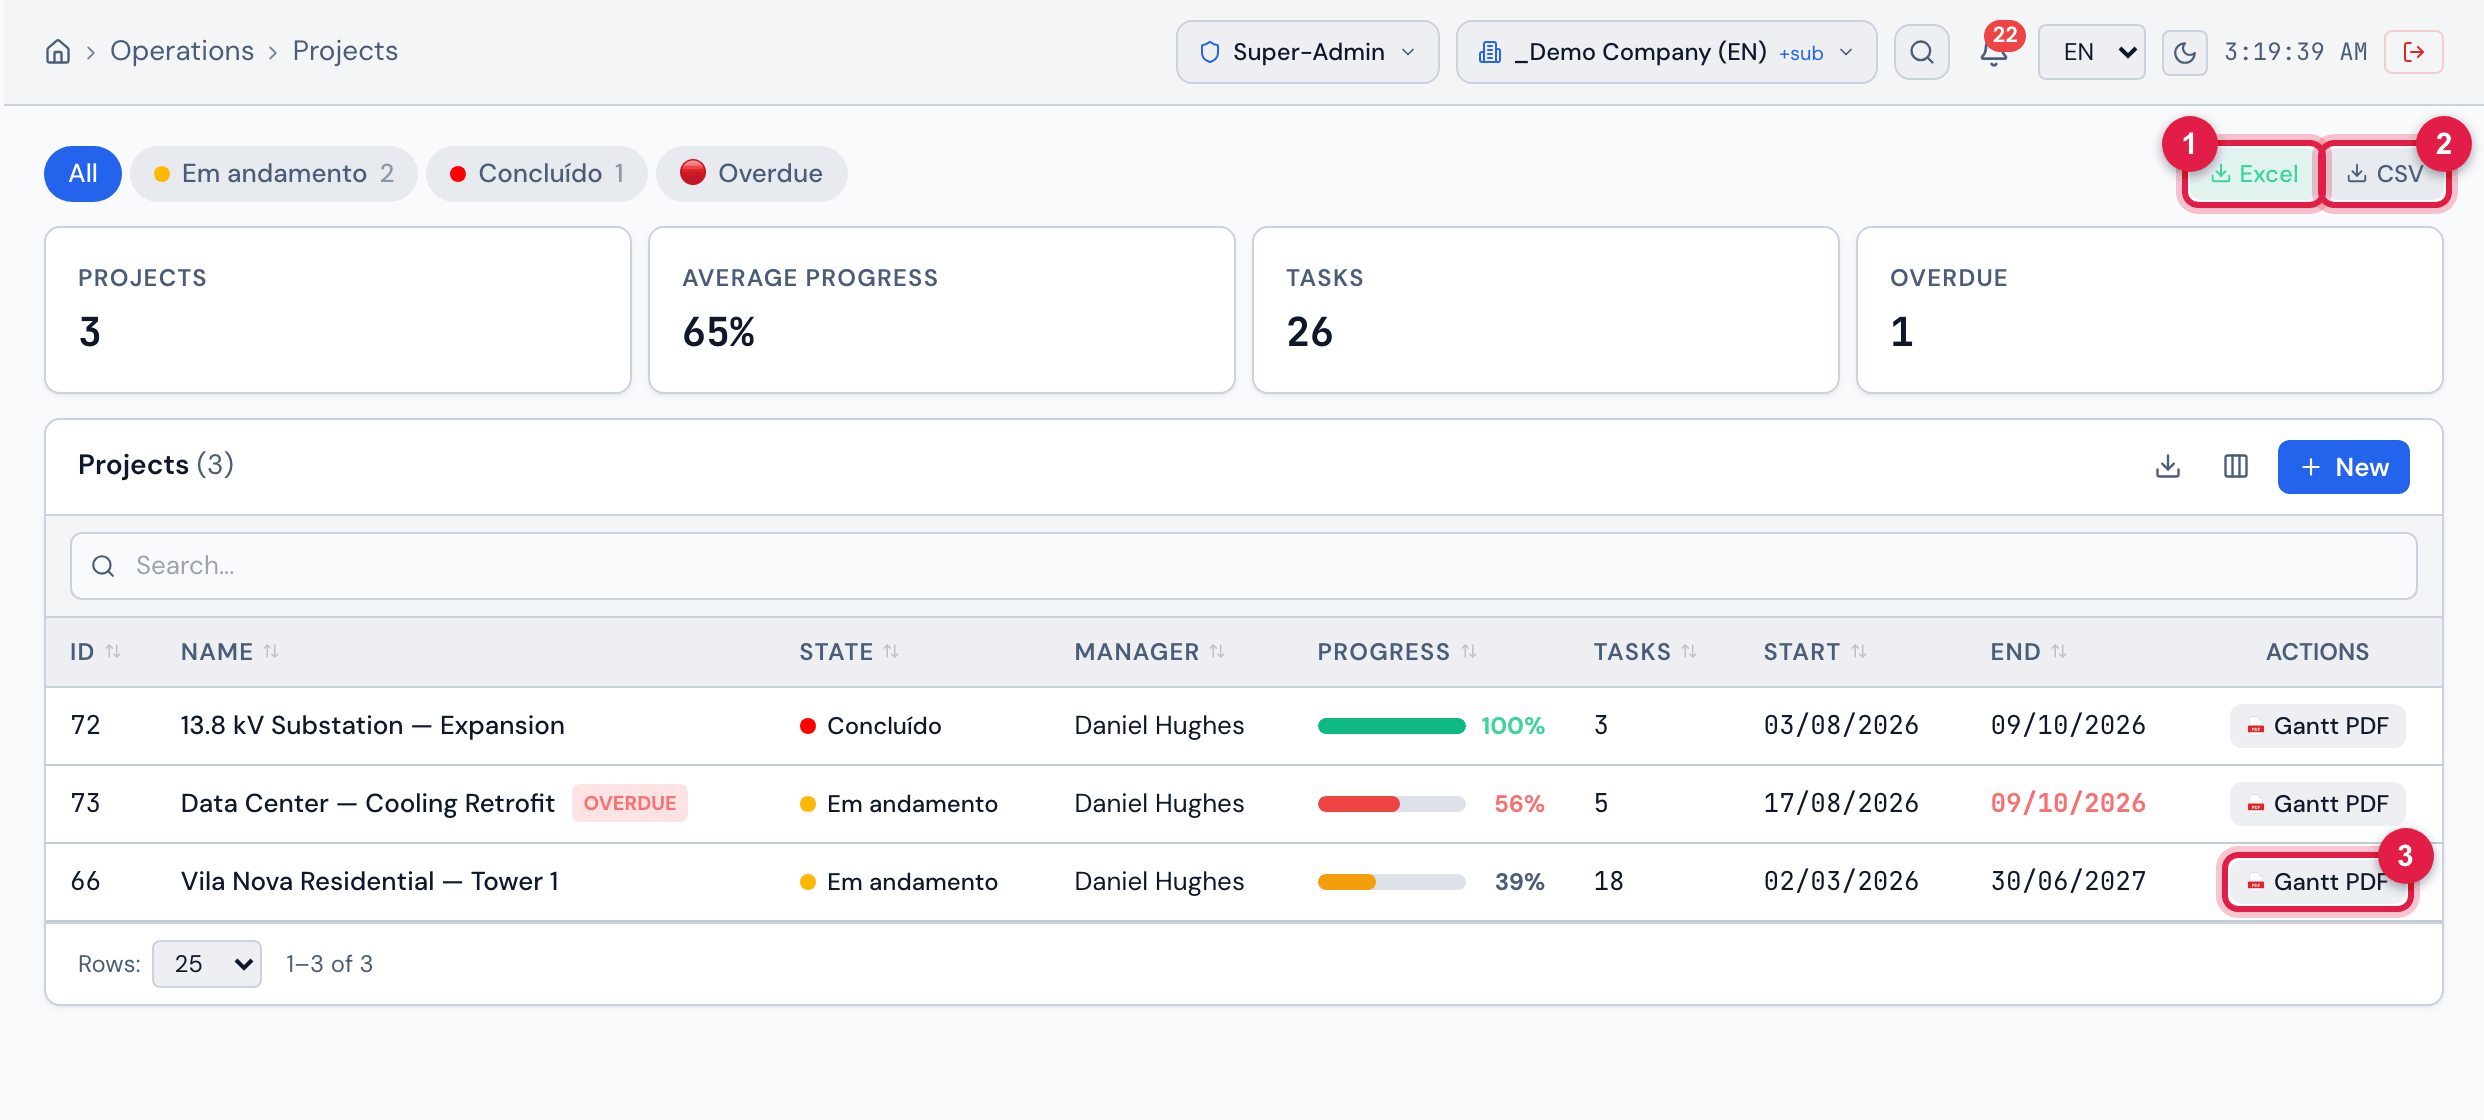
Figure 4. The Excel and CSV buttons at the top of the list and, in each row, the Gantt PDF button of the Actions column.
- 1Excel — downloads projects.xlsx.
- 2CSV — downloads projects.csv.
- 3Gantt PDF of the Vila Nova Residential — Tower 1 row — generates the schedule report of that project (chapter 4).
| Export | What it contains |
|---|---|
| Excel / CSV (top of the list) | a spreadsheet with ID, Project, State, Type, Manager, Entity, Progress %, Tasks, Team, Planned Start, Planned End, Actual Start, Actual End, Overdue (Yes/No), Created and Modified. The headers come out in the screen language. It follows the state or Overdue filter, but not the search. |
| Table Export | the visible columns of the table: Current page or All filtered (includes the search). |
Was this page helpful?
Thanks for the feedback!
Got it — we will improve this page.