
Metering: metrics, readings and anomalies
Manual — Assets · chapter 6 of 12
Every asset record has the Metering tab: it is where you define what to measure on the equipment (the metrics — voltage, current, temperature, pressure, hour meter, consumption) with the acceptable range, and where the readings are recorded, with chart and history. A reading outside the range becomes an anomaly and, if the metric (or the asset) asks for it, opens a corrective ticket by itself. The tab uses the profile’s Measurement right, whatever the asset type.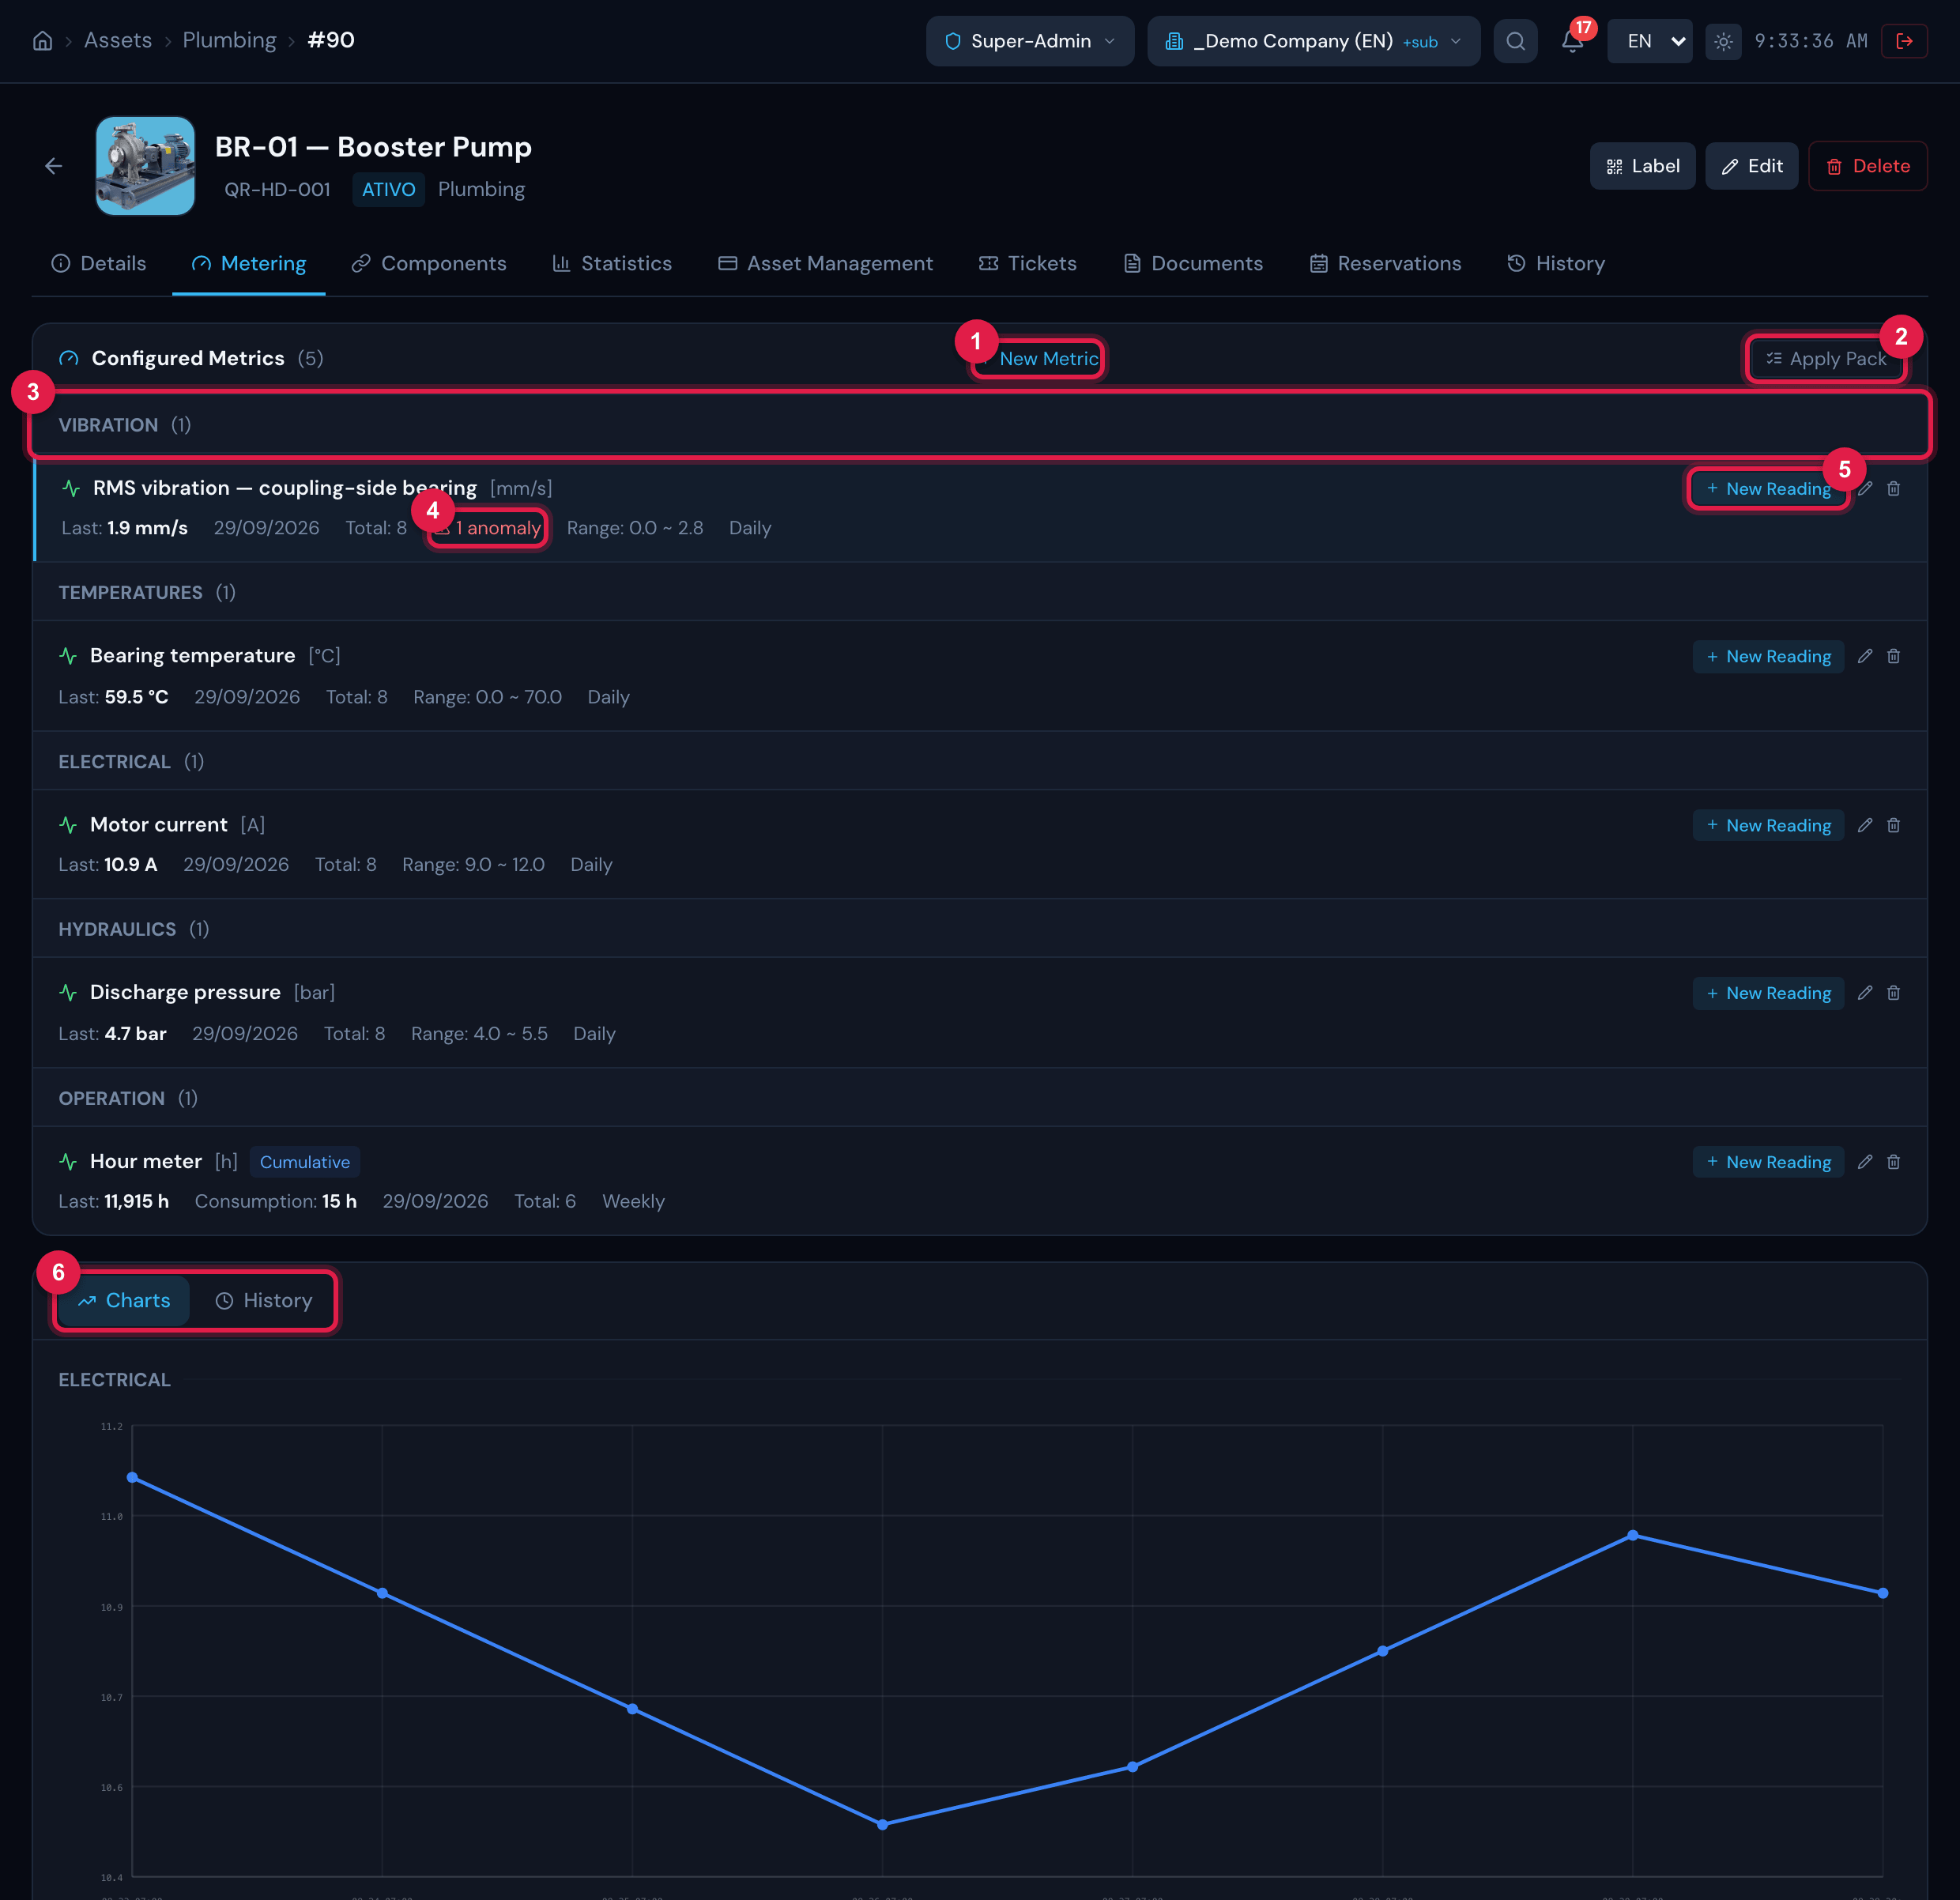
Figure 15. Metering tab of the booster pump: the grouped metrics (each with the latest reading, the total of readings, the anomalies, the range and the interval) and, below, the Charts sub-tab with the group’s series.
- 1New Metric.
- 2Apply Pack — creates several metrics at once.
- 3Metric group header.
- 4Metric with an anomaly (red icon) and the “N anomalies” count.
- 5New Reading of the metric.
- 6Charts and History sub-tabs.
Creating metrics
Section titled “Creating metrics”There are three ways: New Metric (one at a time), Apply Template inside the form (fills in name, unit, typical range and cumulative from a catalog of quantities, by category) and Apply Pack (a ready-made set for an equipment type — Grupo Gerador (GMG), Nobreak (UPS), Climatização de precisão (CRAC), Quadro Geral (QGBT); pack names are in Portuguese). When you apply a pack, the metrics the asset already has (same key or same name) are skipped, and H2O reports how many were created. The packs are the ones that come with H2O; there is no screen to build a new pack.
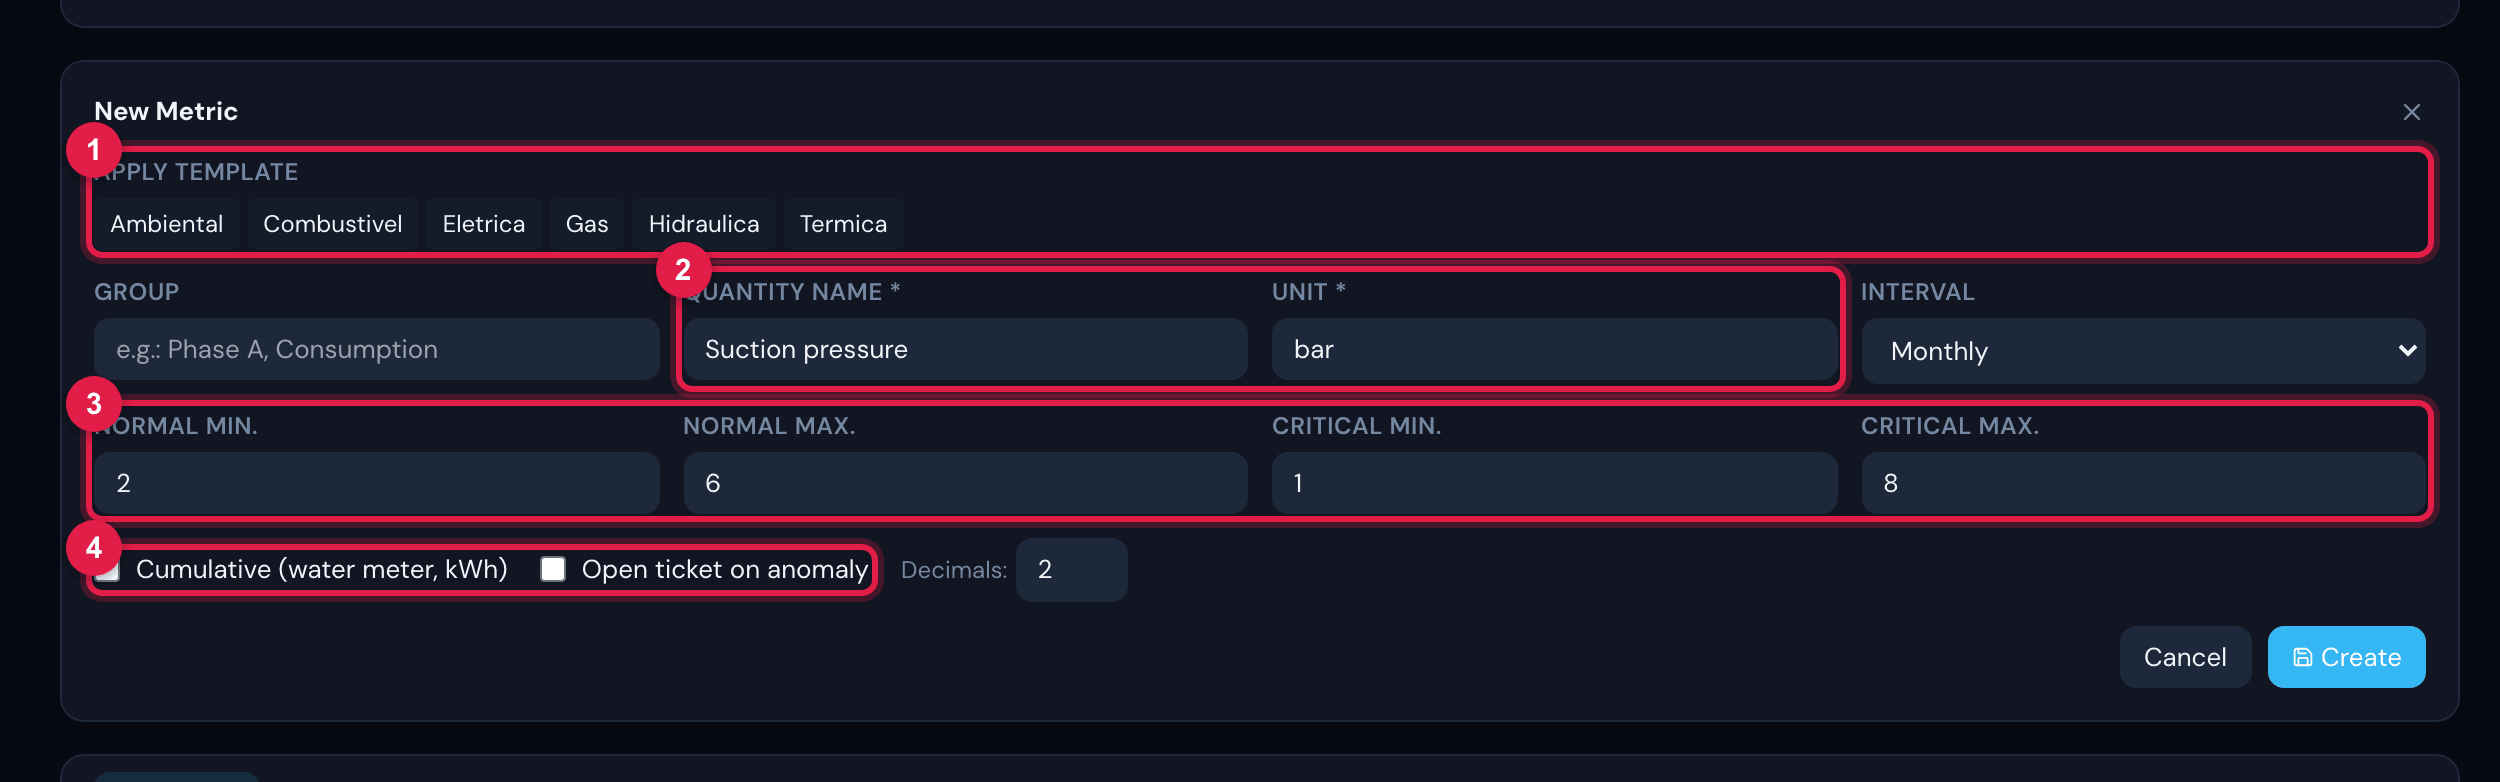
Figure 16. The New Metric form: Apply Template (catalog categories), Group, Quantity Name, Unit, Interval, the normal and critical ranges, Cumulative (water meter, kWh), Open ticket on anomaly and Decimals.
- 1Apply Template — hover over a category and choose the quantity.
- 2Quantity Name and Unit (required).
- 3Normal range (Normal Min., Normal Max.) and critical range (Critical Min., Critical Max.).
- 4Cumulative and Open ticket on anomaly.
| Field | What it is for |
|---|---|
| Group | Groups metrics in the list and in the chart (e.g. “Phase A”, “Motor”). Without a group, the metric goes under “No group” / “General”. |
| Quantity Name and Unit | Required. E.g. Voltage — V; Hour meter — h. |
| Interval | How often the metric should be read: Hourly, Daily, Weekly, Biweekly, Monthly (default), Quarterly, Semi-annual, Annual or On Demand. |
| Normal Min. / Normal Max. | The expected range. Outside it, the reading is an Anomaly (above or below the range). |
| Critical Min. / Critical Max. | The critical range. Outside it, the reading is Critical (above or below the critical range). |
| Cumulative | For counters that only go up (water meter, kWh, hour meter): the range applies to the consumption — the difference from the previous reading —, not to the counter number. |
| Open ticket on anomaly | Opens a corrective ticket when the reading leaves the range (see below). |
| Decimals | Decimal places displayed (0 to 6; default 2). |
Recording readings
Section titled “Recording readings”- In the metric row, click New Reading.
- Enter the Value (required) and check the Date/Time (it comes with the current moment). If you wish, write the Notes and attach a Photo Evidence. The form shows the metric’s normal and critical ranges.
- Click Record. Within the range, H2O confirms Reading recorded; outside it, it warns ⚠ Anomaly detected: with the type (above the range, below the range, above the critical range, below the critical range) and, if a ticket was opened, its number.
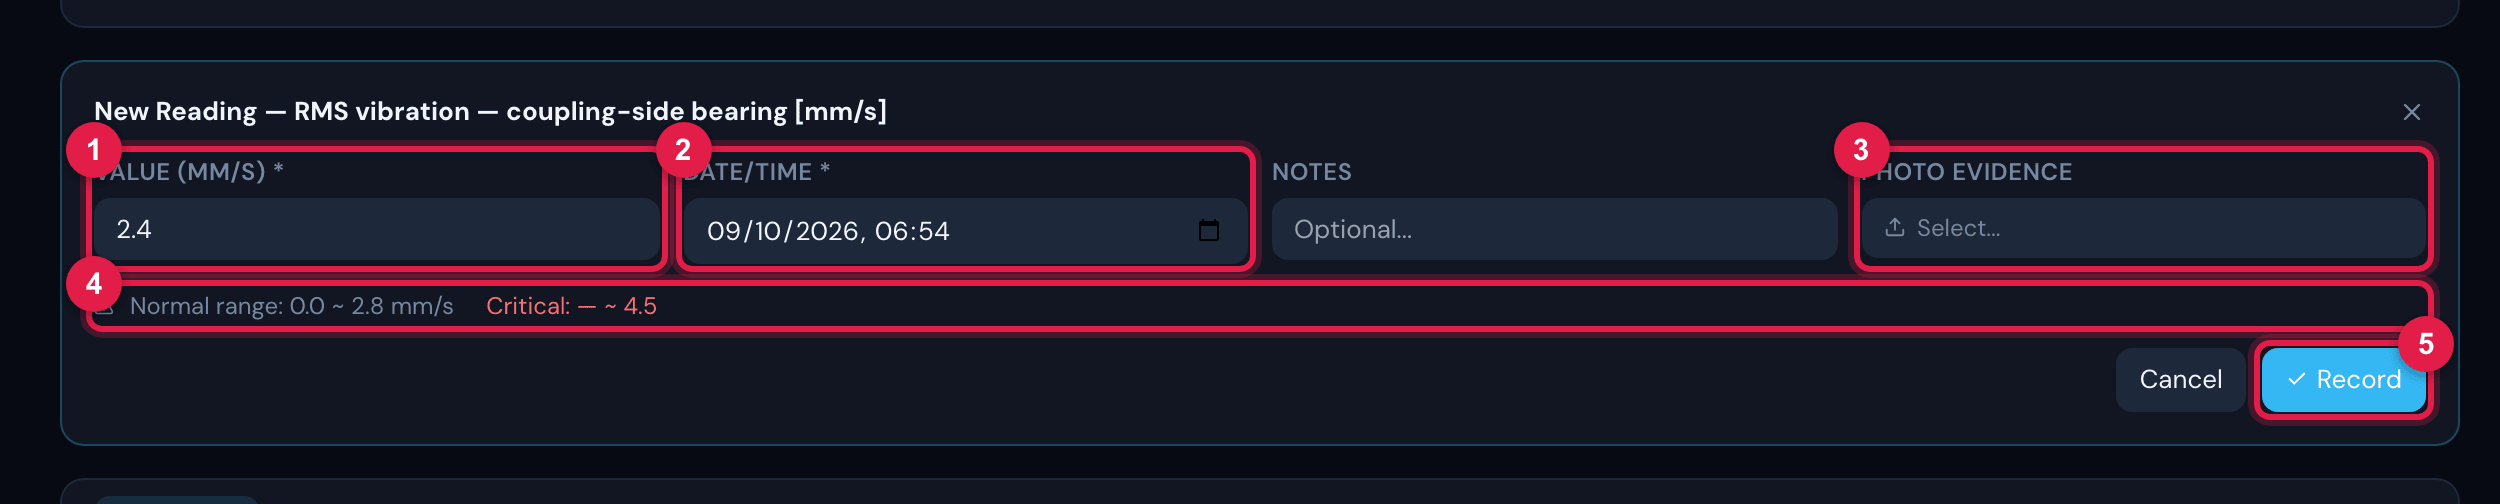
Figure 17. The New Reading form of a metric: value with the unit, date and time, notes, photo evidence and the line with the Normal range and the Critical range.
- 1Value (required).
- 2Date/Time.
- 3Photo Evidence.
- 4Ranges of the metric.
- 5Record.
Automatic ticket on anomaly
Section titled “Automatic ticket on anomaly”With Open ticket on anomaly ticked, any reading outside the range — normal or critical — opens a corrective ticket, as the field’s hint says. The ticket:
- has the title “[Anomalia] <asset> - <metric>: <value> <unit> (Alto, Baixo, CRÍTICO ALTO or CRÍTICO BAIXO)” — written in Portuguese — and is linked to the asset;
- is assigned to the asset’s technician and technical group, with the default SLA of the site’s contract, goes through the ticket rules and triggers the new ticket alert;
- is created with medium urgency and priority (level 3); in a critical anomaly, both go to level 5;
- is a single one per ongoing anomaly: while that metric’s ticket is open, new readings outside the range go into it as follow-ups (and, if the anomaly becomes critical, the priority goes up).
Charts and history
Section titled “Charts and history”- Charts: one chart per group, with the metrics that have at least 2 readings (with fewer, “Minimum 2 readings for chart” appears). Cumulative metrics are plotted by consumption.
- History: all readings of the asset, 50 per page — date, metric (with the group), value, status (Critical, Anomaly or Normal), source, responsible and notes. The trash can removes the reading (Trash right on Measurement).
- To change a metric, use the row’s pencil; the trash can asks Remove “…” and all its readings? and deletes the metric with its history.
Monitoring: all metered assets
Section titled “Monitoring: all metered assets”The Overview › Monitoring menu item (Measurement right) shows, on one dashboard, all assets that have metrics, with the status of each one’s latest reading — Normal, Warning (anomaly), Critical, Overdue and No data — and a search by asset or location. Clicking an asset opens its record.
A metric becomes Overdue when it has had no reading for more than twice its Interval: 2 hours for Hourly, 2 days for Daily, 14 for Weekly, 30 for Biweekly, 60 for Monthly, 180 for Quarterly, 360 for Semi-annual and 730 for Annual. An On Demand metric is never overdue.
Was this page helpful?
Thanks for the feedback!
Got it — we will improve this page.