CMMS for Data Centers and Mission Critical

Preventive maintenance for mission critical, from plan to evidence

A plan per asset that opens the work order ahead of time, based on whichever comes due first: date, hour meter or reading. An annual schedule on the calendar, execution in the app even without signal, and the history of every UPS, generator and CRAC with MTBF and MTTR.

  • Born in mission-critical data centers and used as the maintenance management tool in Uptime Institute® Operational Sustainability audit processes
  • App for Android, iPhone/iPad and Windows, with offline field work
  • Web and app in Portuguese, English and Spanish
H2O · Dashboard
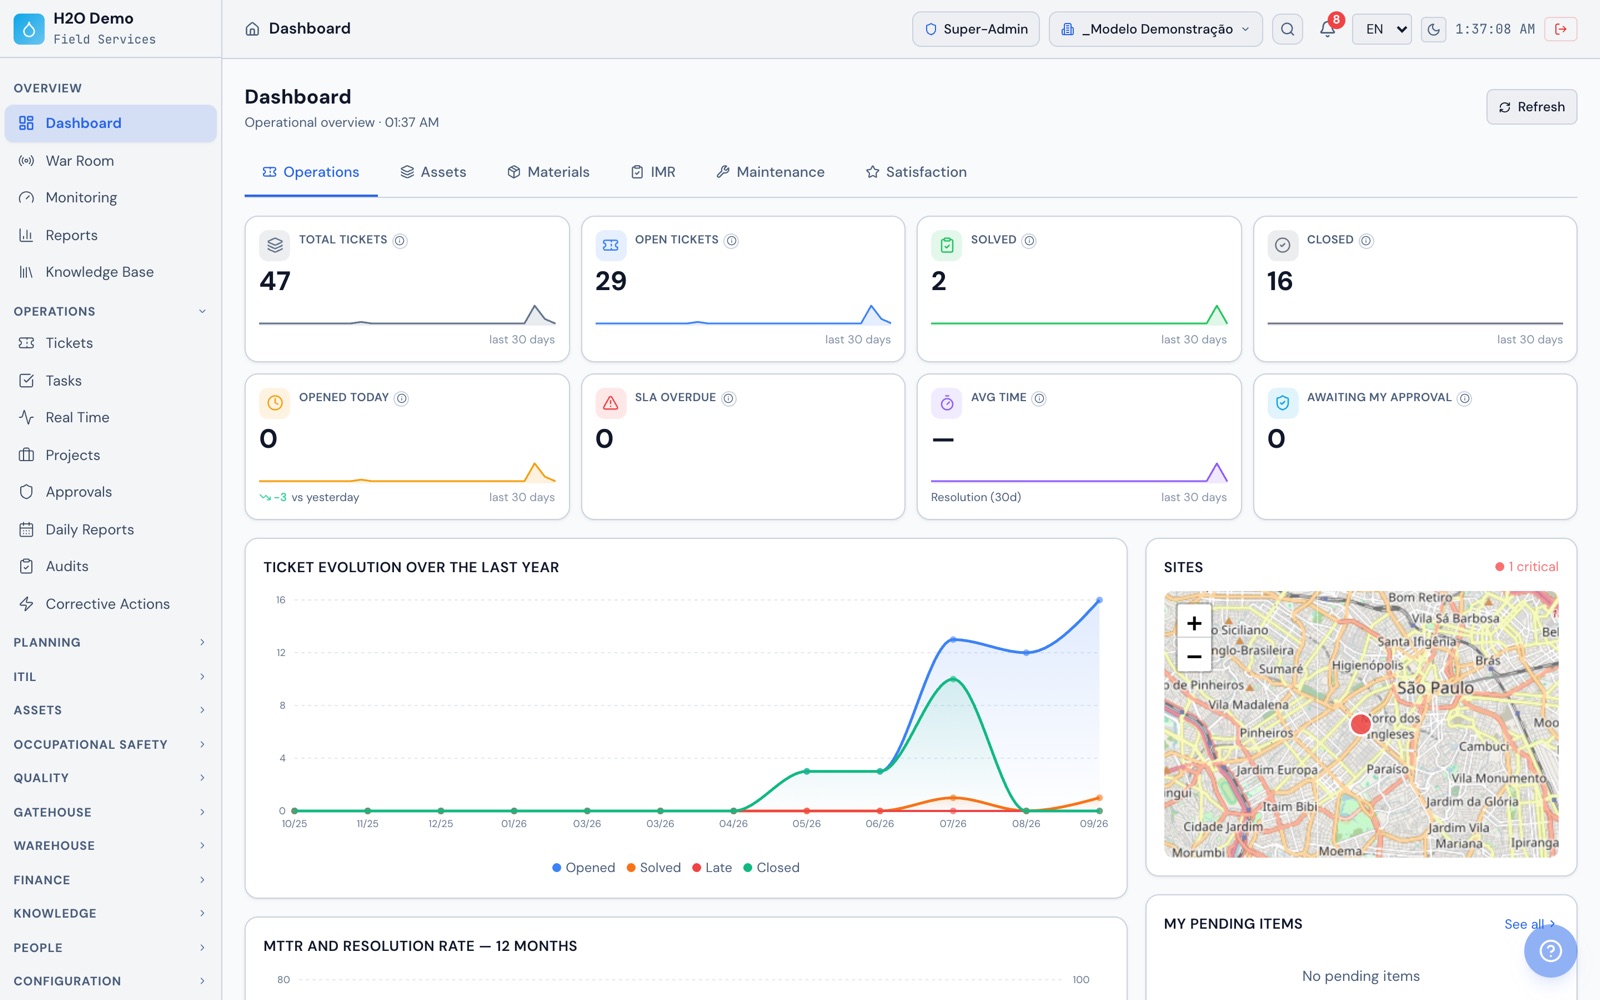
H2O web Dashboard on the Operations tab, with total tickets, tickets opened today, SLA breaches and a map of the sites
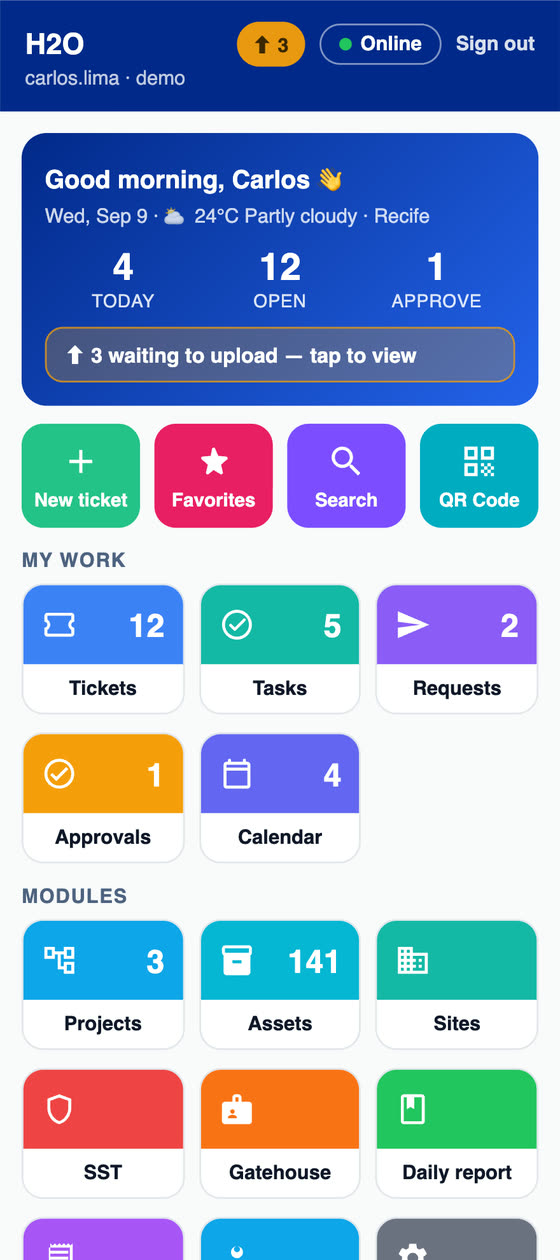
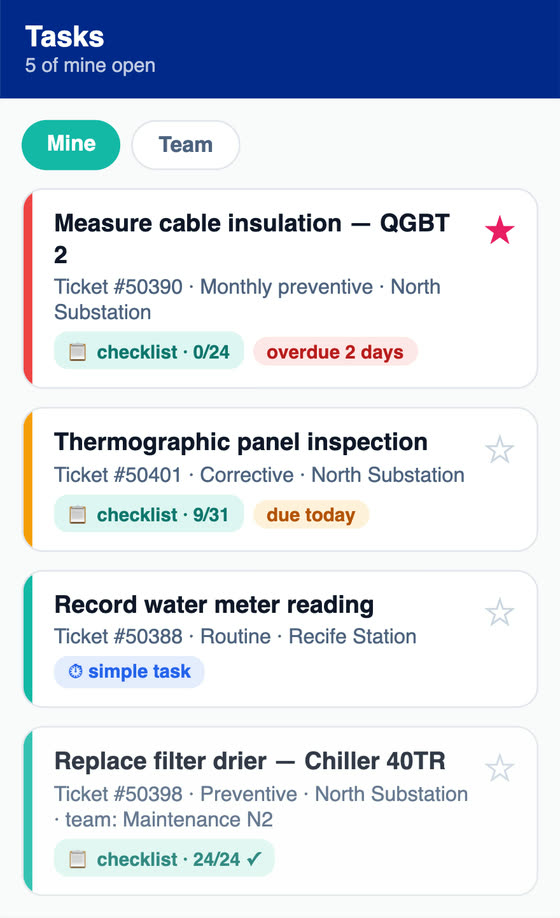
H2O app home screen with the day's tasks and 3 items waiting to be sent
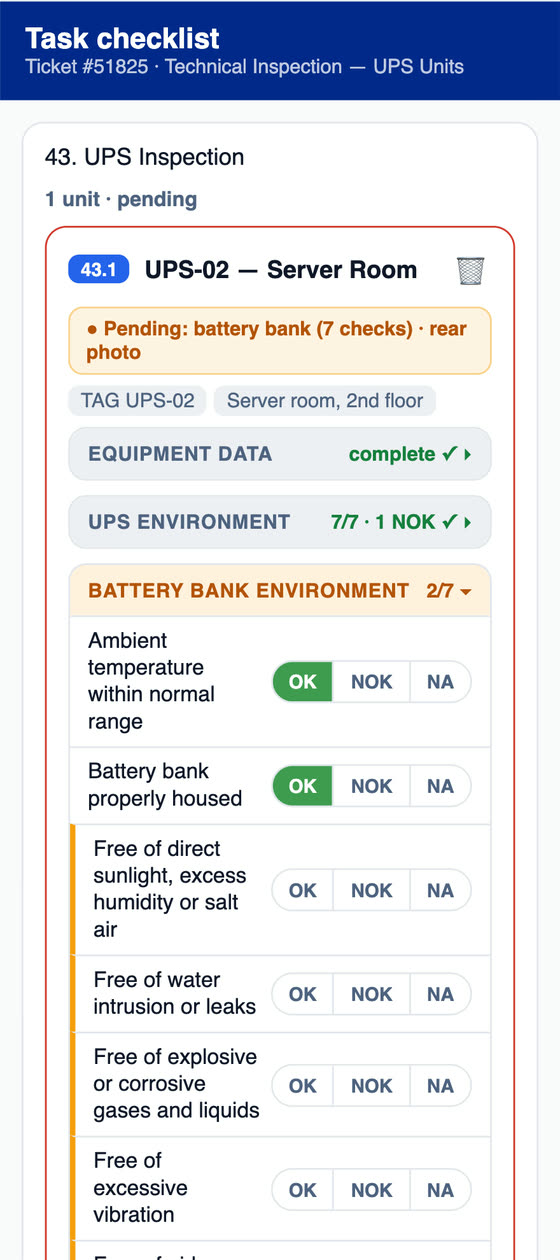
UPS inspection checklist in the H2O app
GMG-01 preventive work order openedthe hour meter came due before the date
CRAC-03 · humidity out of range for 1 daythe plan needs 2 days in a row to open the work order
Mission critical

Born inside mission-critical data centers

H2O was created by people who spent more than 10 years on mission-critical data center projects in Latin America. It was used as the maintenance management tool in Uptime Institute® Operational Sustainability audit processes. In that assessment, the preventive maintenance program and the maintenance processes are among the items reviewed. To show the program is being followed, the operation needs records: what was planned, what was done and the history of each piece of equipment. Those are the records H2O keeps.

  • Maintenance plan per asset, triggered by date, hour meter or reading, with an annual schedule on the calendar
  • Every work order carried out with checklist, readings, photos, signature, date and technician, linked to the asset
  • Asset history with preventive and corrective work, component replacements and a log of who changed what and when
  • MTBF, MTTR and availability per asset, plus a reliability report in PDF

In a data center, the maintenance system is part of the operation. It holds the plan, the execution and the proof of every intervention.

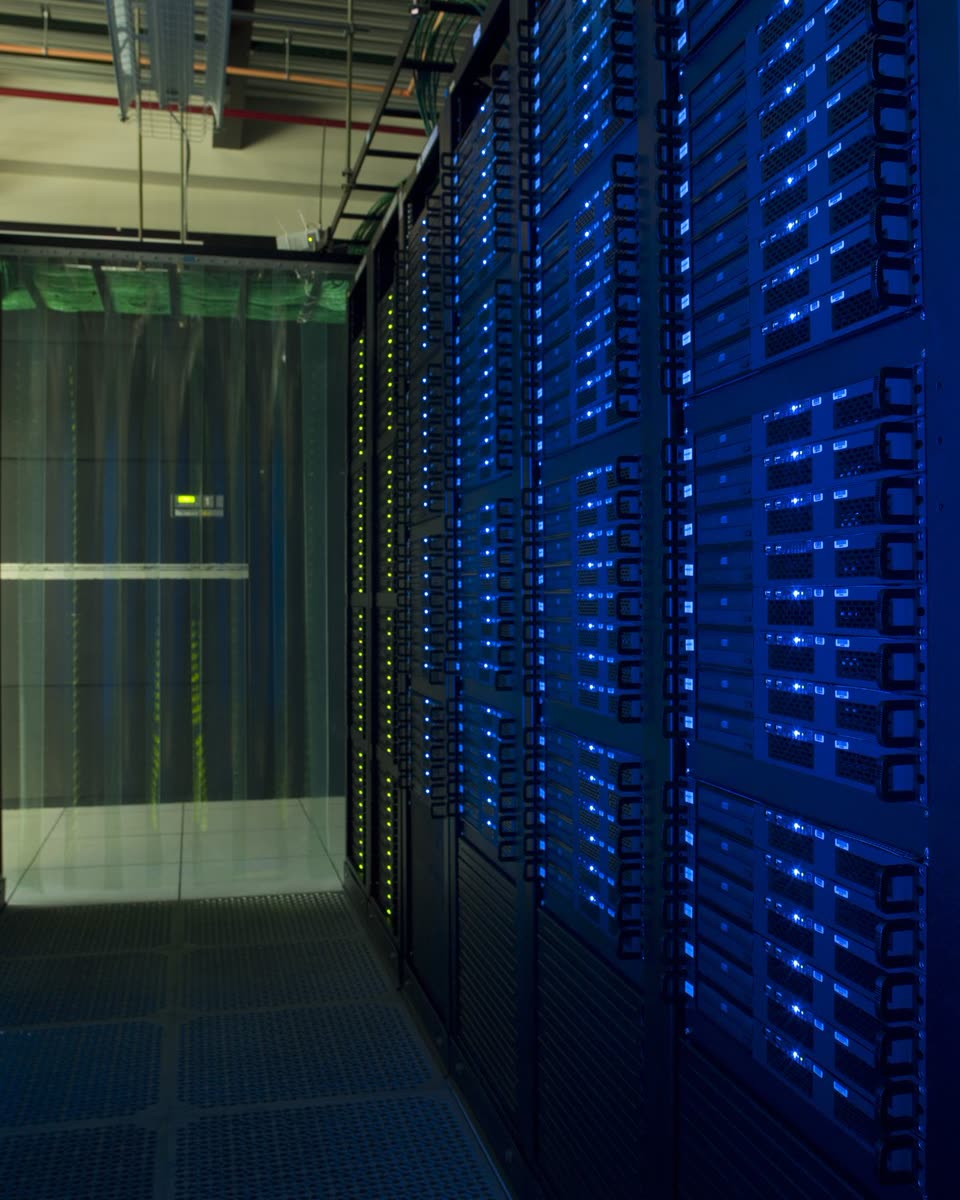
Data center aisle with a row of server racks with blue LEDs and a containment curtain in the background
White space
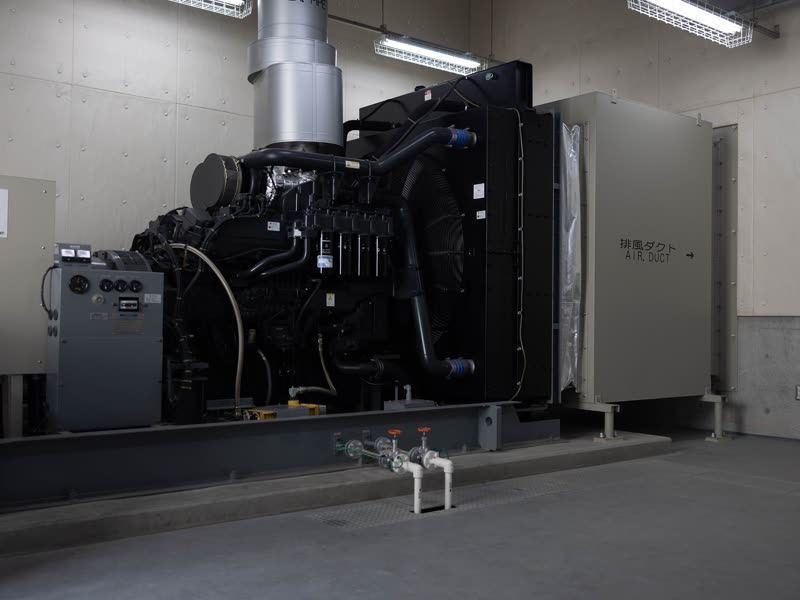
Diesel generator room with a control panel and exhaust duct
Generator set
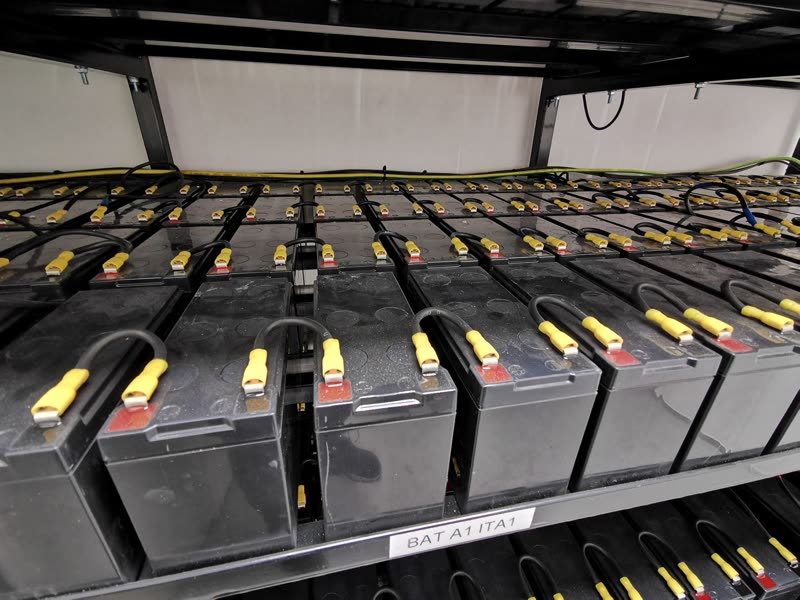
UPS battery bank on a metal rack
UPS batteries
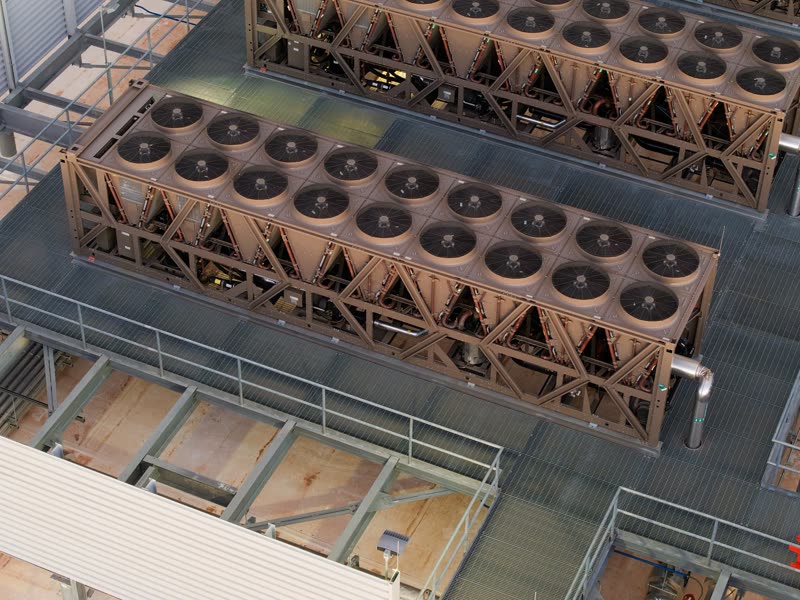
Heat rejection units with rows of fans on a data center roof, seen from above
Heat rejection
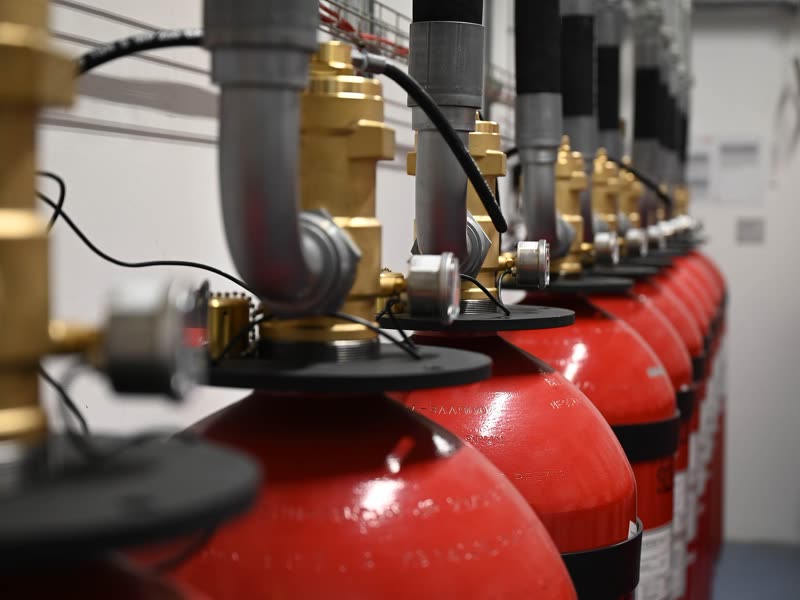
Cylinders of a clean agent fire suppression system
Fire suppression

Uptime Institute® and Tier® are registered trademarks of Uptime Institute LLC. ATG has no partnership with Uptime Institute. Illustrative photos of data center infrastructure, unrelated to ATG customers (Wikimedia Commons, public domain and CC0).

Who uses it

Who uses H2O in the data center

Field and shift technician

Gets the preventive work order in the app, runs the checklist, enters readings, takes photos, collects the signature and generates the PDF, even with no signal in the battery room.

Maintenance planning (PCM)

Creates the plans per asset, builds the annual schedule and checks on the calendar what is scheduled, what has already become a work order and what is late.

Maintenance supervisor

Watches the maintenance dashboard for plans due in 7 days and late ones, and uses Monitoring to spot equipment out of range or with overdue readings.

Facilities or infrastructure manager

Brings the executive report in PDF or PowerPoint to the client meeting, along with the reliability report with the MTBF and MTTR of the assets.

Engineering

Builds the dependency diagram, reviews the impact analysis and records the change with a rollback plan and approval before the maintenance window.

NOC operator

Keeps the War Room on the video wall: tickets by priority, sites on the map, the technicians' last known location and a voice alert for new tickets.

Before and after

From the spreadsheet to a maintenance plan in the system

What usually lives in spreadsheets, paper or email in data center maintenance, and where it goes in H2O.

TodayThe annual maintenance plan lives in a spreadsheet that only one person knows how to update.
With H2OThe plan lives in the system, per asset, with trigger, checklist, technician and group. The annual schedule generates the year's work orders and the calendar shows what is coming up.
TodayThe generator's preventive maintenance comes due and nobody notices until the alarm goes off.
With H2OThe plan opens the work order with the lead time you set, based on whichever comes due first: days, hour meter hours or a reading past its limit.
TodayThe preventive work gets done, but the record stays on a sheet of paper or on the technician's phone.
With H2OThe plan's work order is carried out in the app with checklist, photos, signature and PDF, and is recorded in the asset history.
TodayNobody can say, on the spot, how many preventive jobs are late.
With H2OThe Maintenance tab of the Dashboard shows late plans, plans due in the next 7 days and plan work orders completed this month.
TodayThe shift round stays on a clipboard and the main switchboard voltage reading gets lost in the files.
With H2OEach patrol item points to an asset. The reading goes into the equipment's history and chart, already flagged as normal or out of range.
TodayReplacing the UPS battery bank catches the team by surprise.
With H2OThe bank is set up as a component with a lifespan by time or by usage, and the asset shows whether it is on time, due soon or expired.
TodayAt audit time, the evidence is scattered across phones, network folders and paper.
With H2OPlan, completed work order, required photo per item, signature, a PDF of each checklist, asset history and change log all live in the same system.
Maintenance plan

How the plan keeps preventive maintenance on schedule

The cycle H2O repeats for every active plan, from setup to the next preventive job. Setup happens on the web and execution in the app.

  1. 1

    Asset and checklist

    The plan starts from an asset, such as GMG-01 or UPS-02, and a checklist template with the items, tolerance ranges and required photos. For several assets of the same type, the same plan can be created in one go.

  2. 2

    Triggers

    Every N days, every X hour meter hours, or when a reading crosses its limit, with the option to require N days in a row out of range. A plan can have all three, and whichever comes due first wins. Usage and condition triggers use the readings of a metric set up on the asset.

  3. 3

    Daily evaluation

    Once a day, H2O recalculates the next date for every active plan. For usage triggers, the date is projected from the average consumption of the latest readings. By default, only assets in operation generate work orders.

  4. 4

    Work order ahead of time

    Within the lead time you set, 7 days by default, the plan opens the work order with the checklist, technician and group, and automation rules are applied to it. While the previous work order is still open, the plan does not open another.

  5. 5

    Execution in the field

    The technician gets the work order in the app and runs the checklist on site, even without signal, with readings, photos, signature and the PDF generated on the device.

  6. 6

    Close and restart

    When the work order is solved or closed, the plan records the execution date and restarts the count. For usage triggers, the last hour meter reading becomes the new baseline. The plan history keeps every evaluation, every work order generated and every restart.

Preventive work in the field

The plan's work order reaches the technician and comes back complete to the asset history

Four screens from the H2O app, with sample data. The preventive job generated by the plan is carried out on site, even in a basement with no signal, and nobody has to go back to the office to type it up.

  1. The plan's work order in the technician's list
    1Receive

    The plan's work order in the technician's list

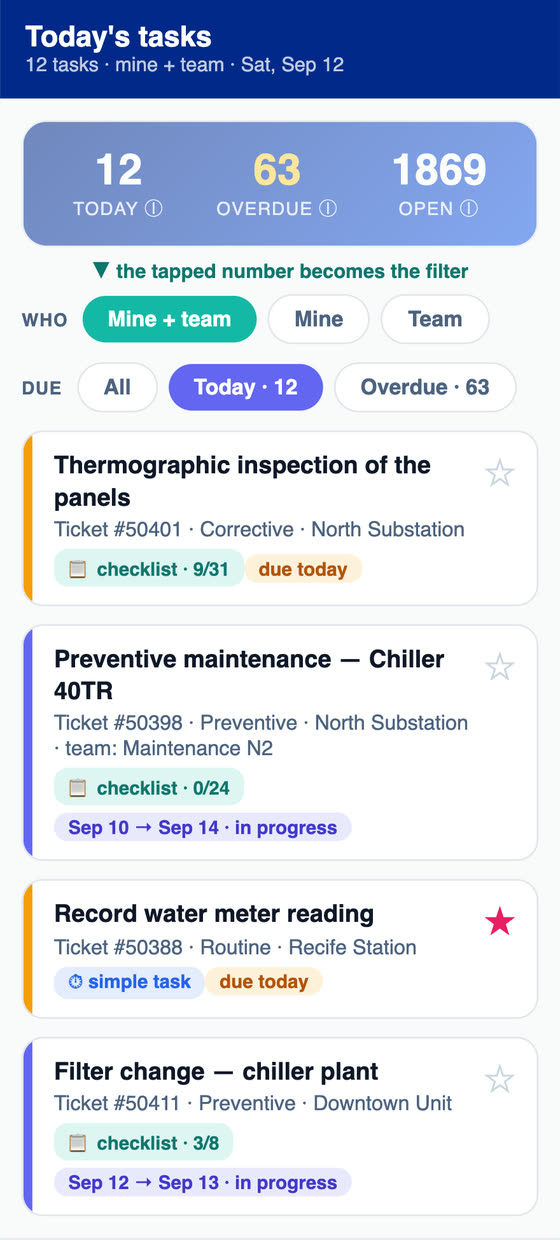
    The preventive job shows up in the tasks of the technician and the team, with checklist progress and the deadline. The filter separates what is due today from what is late.

  2. Switchboard preventive, panel by panel
    2Execute

    Switchboard preventive, panel by panel

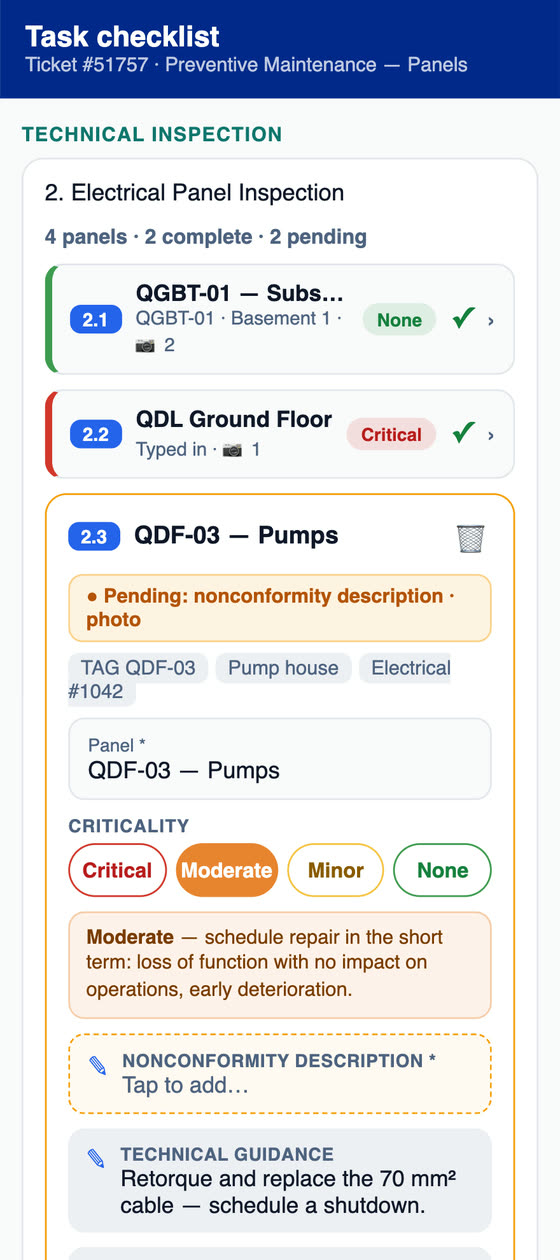
    The technician identifies each panel by QR code, from the list or by name, and records the criticality on four levels, the non-conformance, technical guidance and photos.

  3. UPS checked item by item
    3Verify

    UPS checked item by item

    In the UPS inspection, each check is answered OK, NOK or NA, by group: equipment data, environment and battery bank. Anything missing shows as pending, with the photo the item requires.

  4. Signature, PDF and the plan restarts
    4Close

    Signature, PDF and the plan restarts

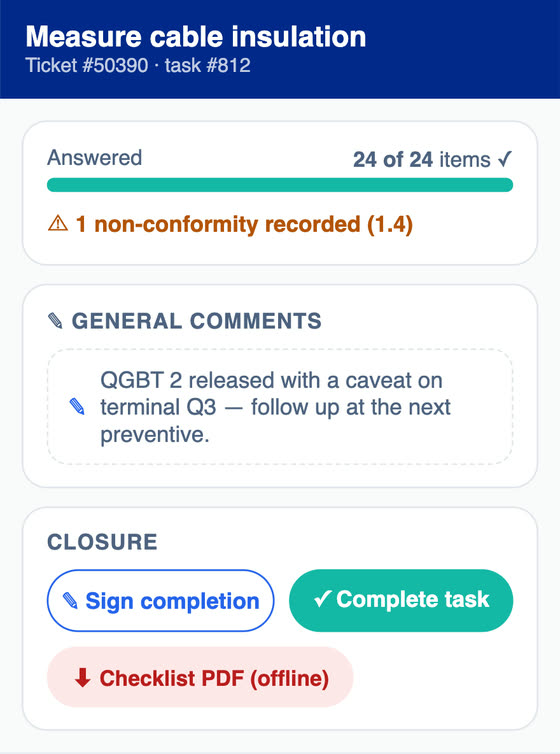
    Technician and client sign on screen, and the checklist PDF is generated on the device, even offline. When the network comes back, the work order receives the answers, measurements and photos, and once it is closed the plan restarts its count.

By area of work

From plan to history, with components, measurements and diagrams

What the technician uses on the phone and what planning, supervision and engineering follow on the web. The web screens are from the demo environment.

Maintenance plan

A plan per asset that opens the work order before it comes due

Each plan links an asset to a checklist template and to one or more triggers: time, usage and condition. Whichever comes due first wins. The plan opens the work order with the lead time you set, already with checklist, technician and group, and restarts the count when the work order is solved or closed.

  • Usage by hour meter, with the projected date calculated from the average consumption of the latest readings
  • Condition by a reading above, below or outside a range, with the option to require N days in a row
  • By default, only assets in operation generate work orders, and the plan does not open another work order while the previous one is still open
  • The same plan created for several assets of the same type in one go
  • Plan history with every evaluation, every work order generated and every restart
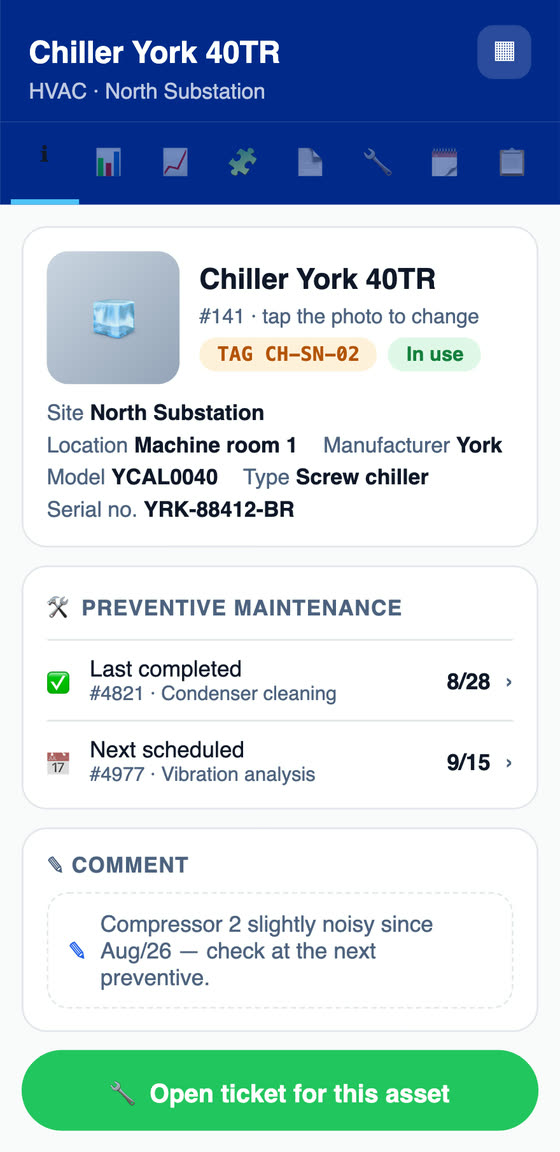
On the phoneIn the app, the asset record with the last completed preventive job, the next scheduled one and the button to open a ticket for the equipment.
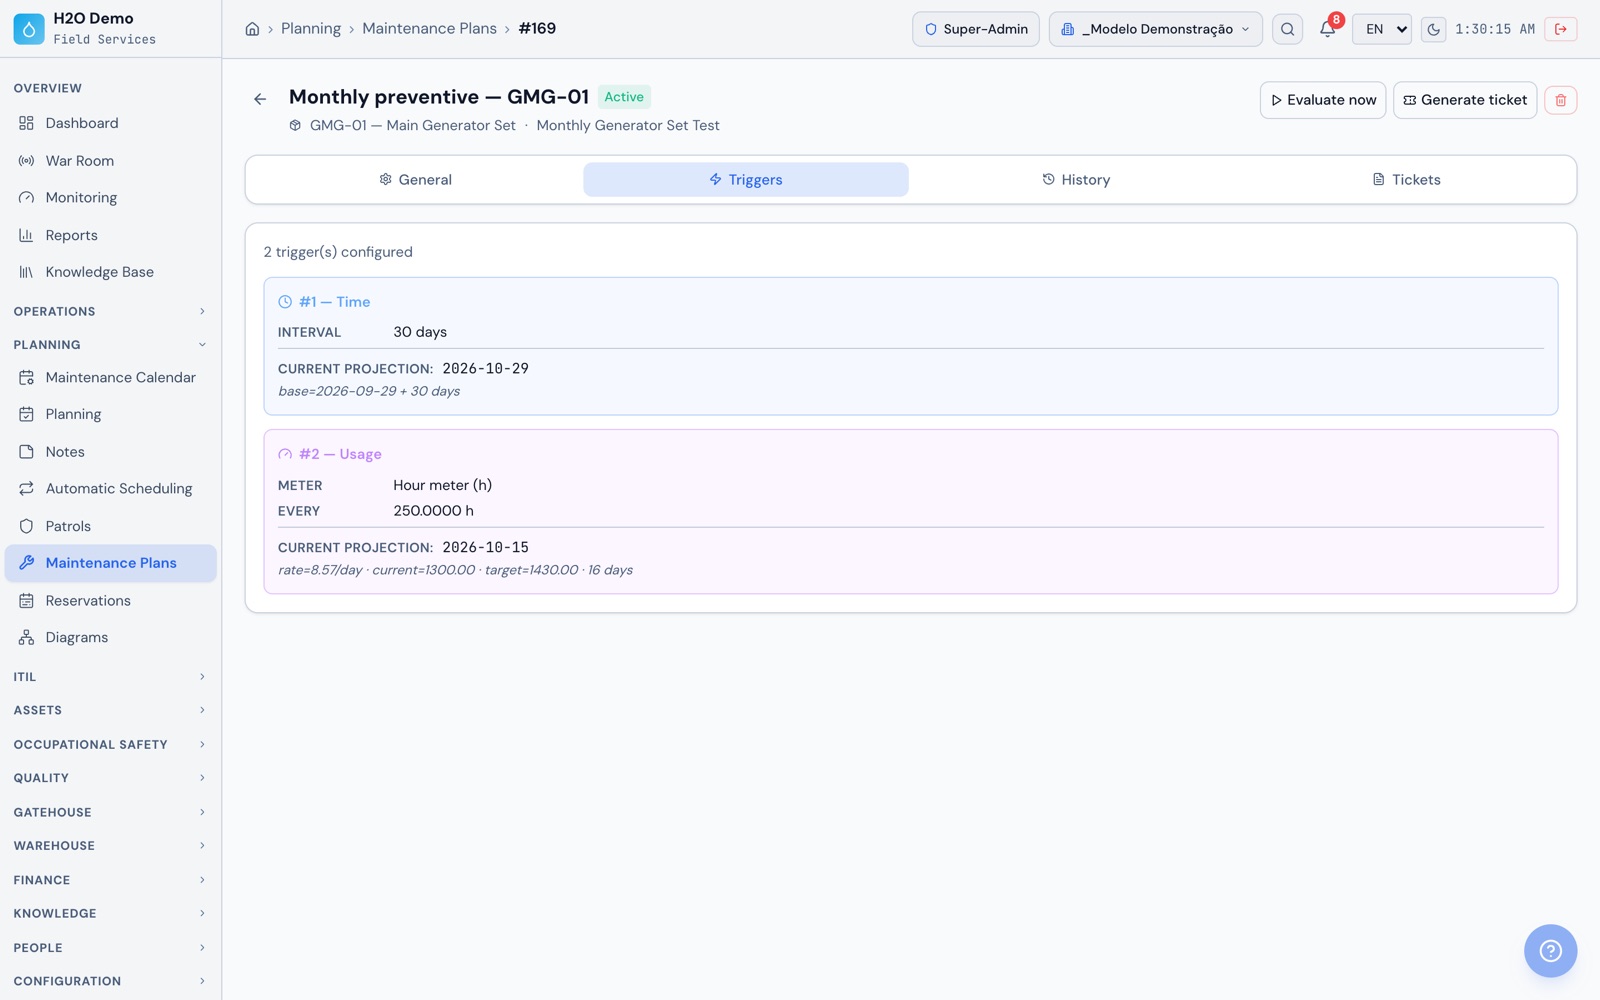
At the officeOn the web, the GMG-01 plan with two triggers, every 30 days and every 250 hour meter hours, and the next projected date for each.
Planning › Maintenance Plans › GMG-01
H2O web: the GMG-01 plan with two triggers, every 30 days and every 250 hour meter hours, and the next projected date for each.
H2O app: the asset record with the last completed preventive job, the next scheduled one and the button to open a ticket for the equipment.
Annual schedule

Annual schedule and maintenance calendar

In Automatic Scheduling, build the year's schedule by linking each asset to a checklist template, using the template's frequency, from daily to yearly or every N days. H2O generates all the work orders for the period at once with Planned status, moves dates that fall on non-working days or holidays of the chosen calendar to the nearest business day, and shows the estimated hours.

  • Rescheduling from a given date, or moving one work order together with the ones after it
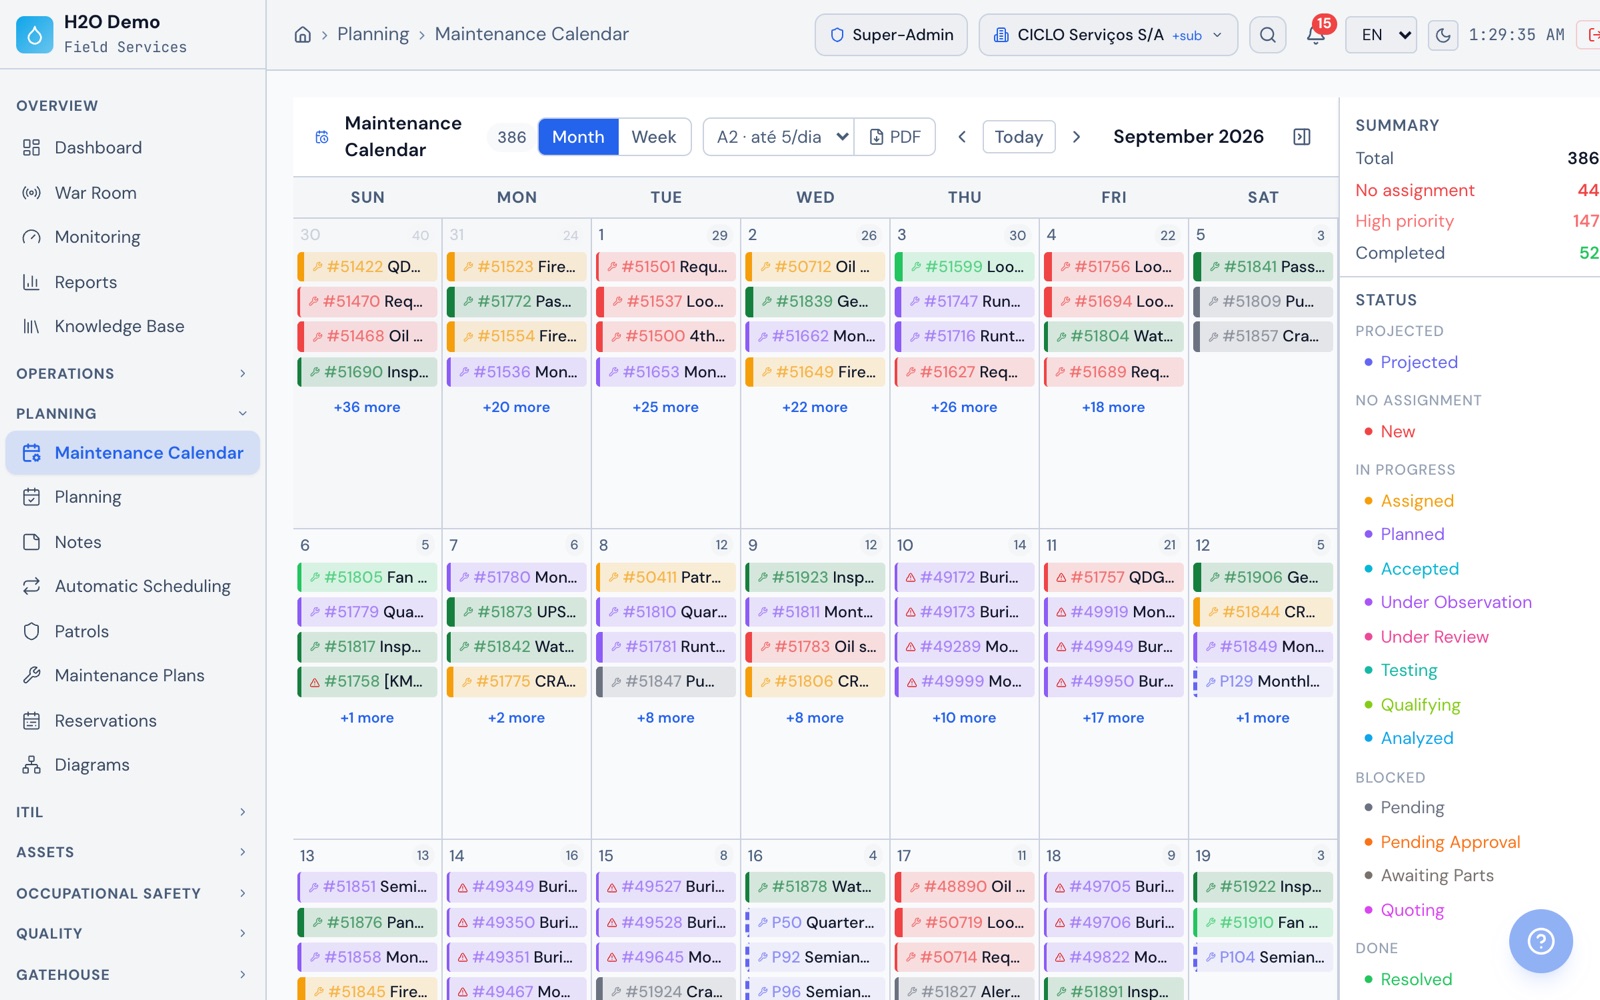
  • Monthly or weekly calendar with work orders color-coded by status and filters by group and technician
  • The next preventive job of each plan appears on the calendar before the work order exists
  • Monthly calendar exported to PDF
On the phoneIn the app, today's and late tasks, mine or the team's, with the checklist progress of each preventive job.
At the officeOn the web, the monthly calendar with each day's work orders color-coded by status, the next preventive job of each plan, the month summary and the status legend.
Planning › Maintenance Calendar
H2O web: the monthly calendar with each day's work orders color-coded by status, the next preventive job of each plan, the month summary and the status legend.
H2O app: today's and late tasks, mine or the team's, with the checklist progress of each preventive job.
Components

Component tracking: batteries, filters and compressors with replacement forecasts

Each component is linked to its asset, such as the UPS battery bank, the generator filters and the chiller compressors, with an installation date and a lifespan by time, by usage or whichever comes first. The asset shows whether the component is on time, due soon or expired, and keeps every replacement. The UPS and the generator also have their own technical data sheets.

  • Lifespan in months or in hours of use, with the status calculated from installation or the last replacement
  • History of every replacement with date and reason; a replacement restarts the lifespan count
  • Component status on the RAT (service report), the checklist and the technical report, and an email alert when it becomes due soon or expired
  • UPS with kVA, voltages, runtime, number of batteries, battery replacement date and topology
  • Generator with voltage, current, power, frequency, phases and engine data, plus a generator technical report with the ATS transfer sequence
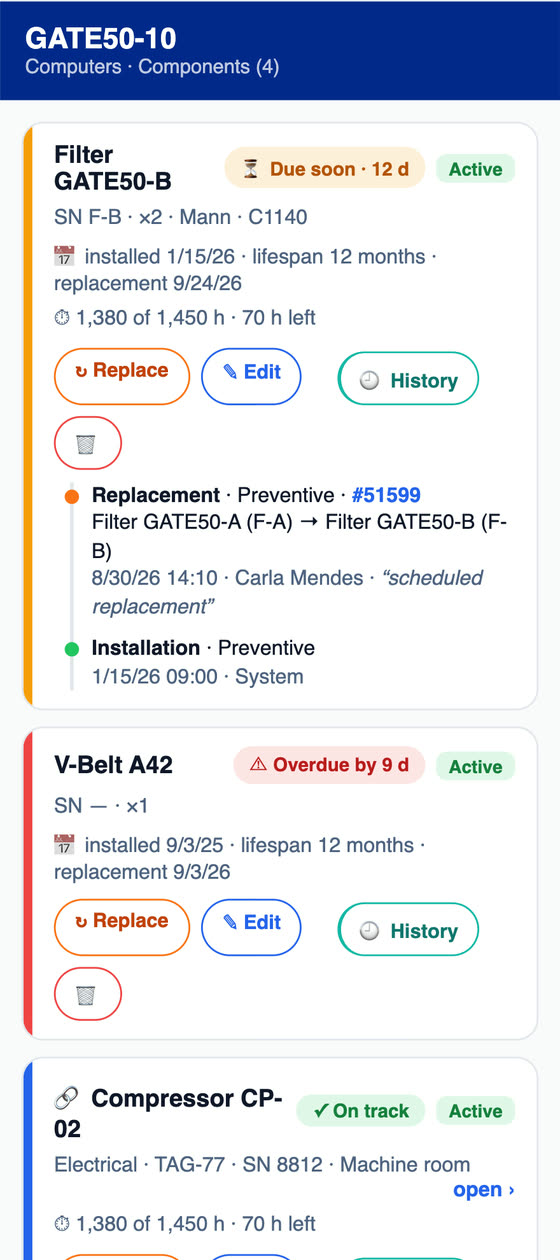
On the phoneIn the app, the asset's components with lifespan, next replacement date, status (on time, due soon or expired) and replacement history.
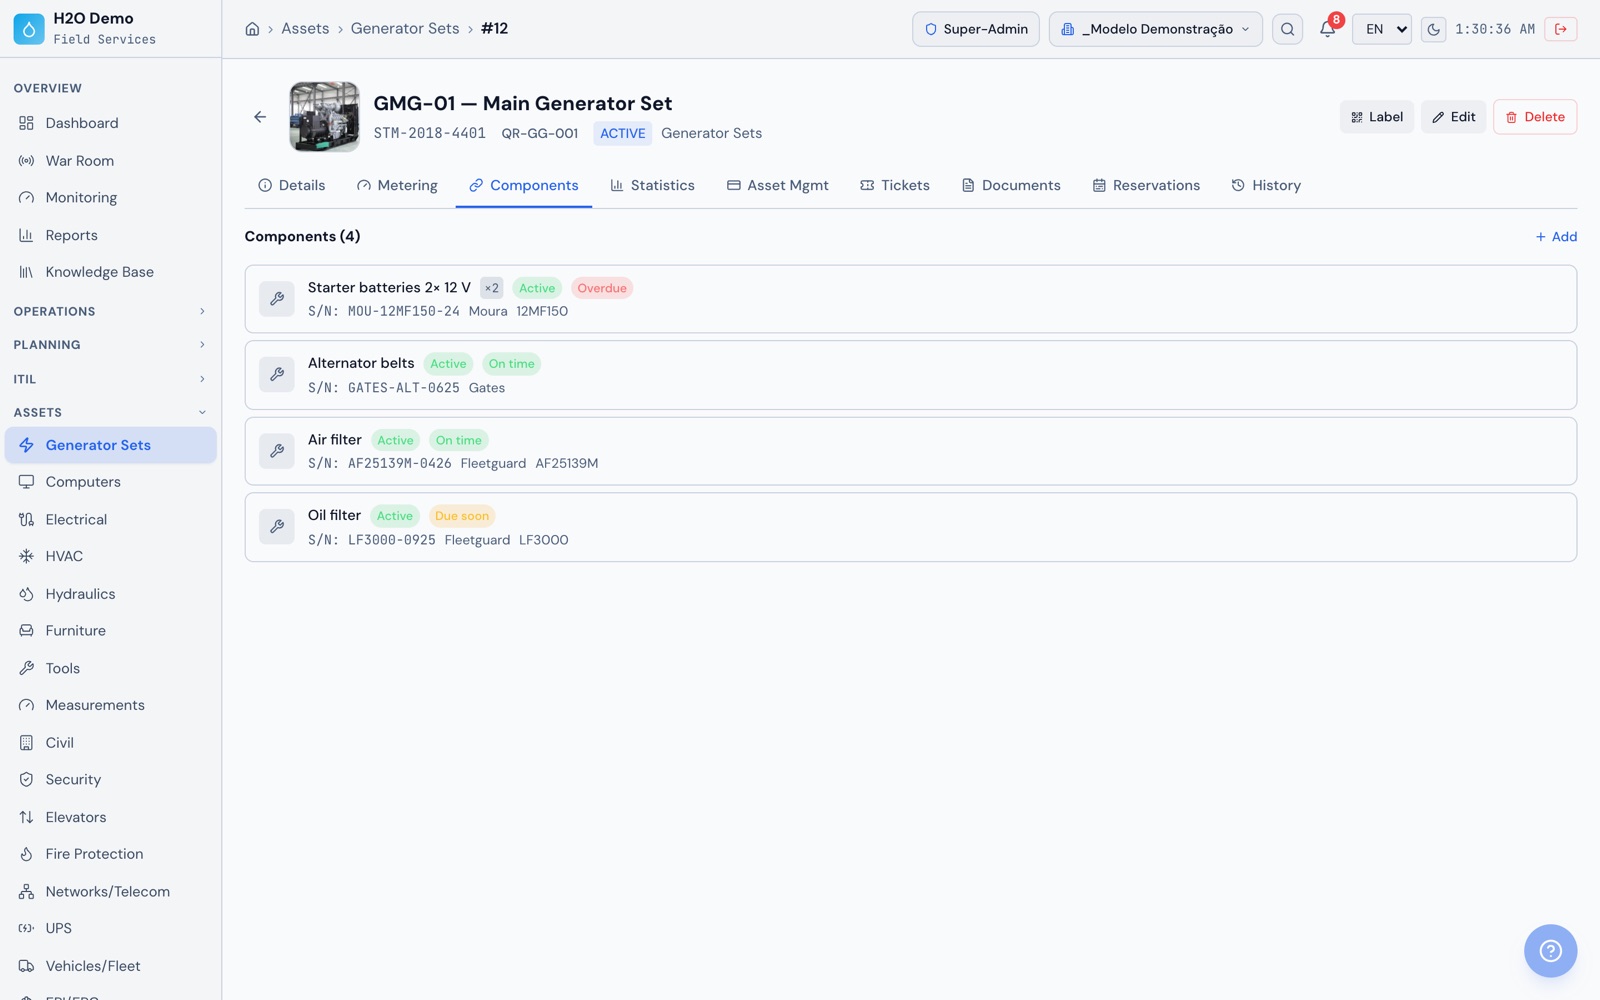
At the officeOn the web, the GMG-01 components with the status of each one: on time, due soon or expired.
Assets › Generator Sets › GMG-01
H2O web: the GMG-01 components with the status of each one: on time, due soon or expired.
H2O app: the asset's components with lifespan, next replacement date, status (on time, due soon or expired) and replacement history.
Measurements

Measurements per piece of equipment, with expected and critical ranges

Set up the metrics that matter on each asset: voltage per phase, UPS load, CRAC return temperature, humidity, diesel level, hour meter. Each metric has a unit, an expected range, a critical range and a reading frequency. Readings come in from the web, the app, patrols or the API, and are classified on arrival.

  • Ready-made metric packages to apply to an asset in one go
  • Metrics grouped by system on the asset, such as electrical, hydraulic and temperatures
  • Low, high, critical low or critical high readings, highlighted on the chart with limit lines
  • Cumulative metrics, such as consumption and hour meter, and a photo with the reading
  • In the app, a reading taken without signal waits in the queue and uploads when the network comes back
  • The same readings feed the plans' condition and usage triggers
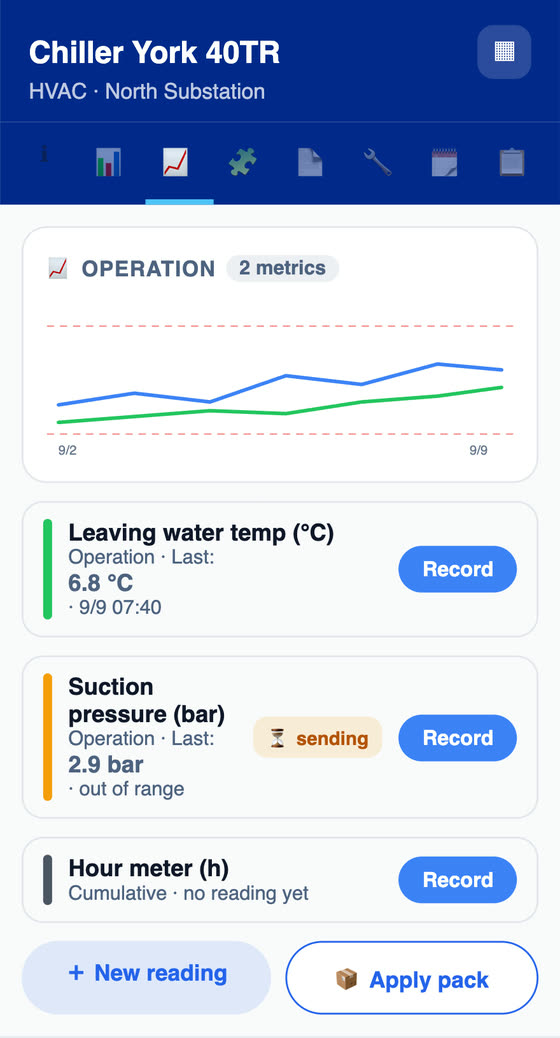
On the phoneIn the app, the asset's measurements with the chart and limit lines, the out-of-range reading and the hour meter.
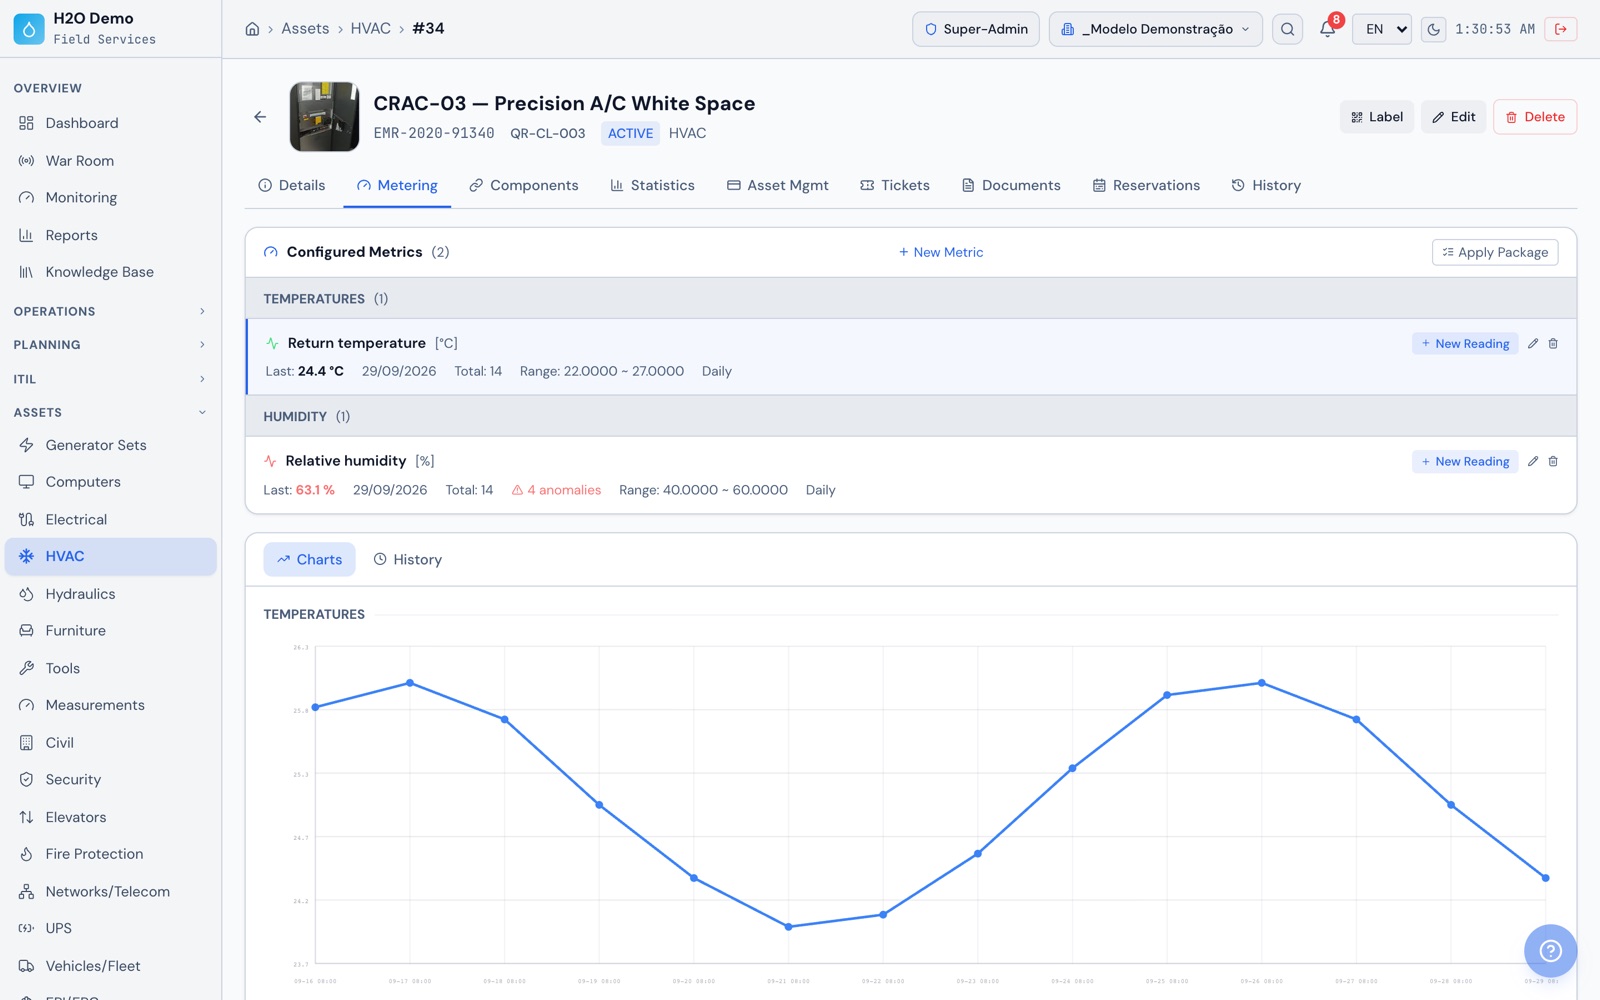
At the officeOn the web, the CRAC-03 metrics with the range of each one, humidity with 4 readings out of range and the readings chart.
Assets › HVAC › CRAC-03
H2O web: the CRAC-03 metrics with the range of each one, humidity with 4 readings out of range and the readings chart.
H2O app: the asset's measurements with the chart and limit lines, the out-of-range reading and the hour meter.
Patrols and monitoring

Shift patrols and a dashboard of what is out of range

Build the patrol for the UPS room or the white space from a checklist template where each item points to an asset. The technician marks Done, Not done or NA and enters the equipment readings in the same item. The Monitoring dashboard brings together the assets with metrics and shows which are normal, need attention, are critical or have no reading on time.

  • Daily, weekly, monthly or on-demand frequency, with default technician, group and time
  • Patrol work order opened by the daily routine or on the spot with the Execute button
  • Patrols per shift: one setup for each shift
  • Dashboard with Normal, Attention, Critical, Late and No data, and the latest reading of each metric
  • Out-of-range readings are highlighted on the dashboard and on the asset
On the phoneIn the app, the patrol item by item with Done, Not done or NA and each equipment reading, even without signal.
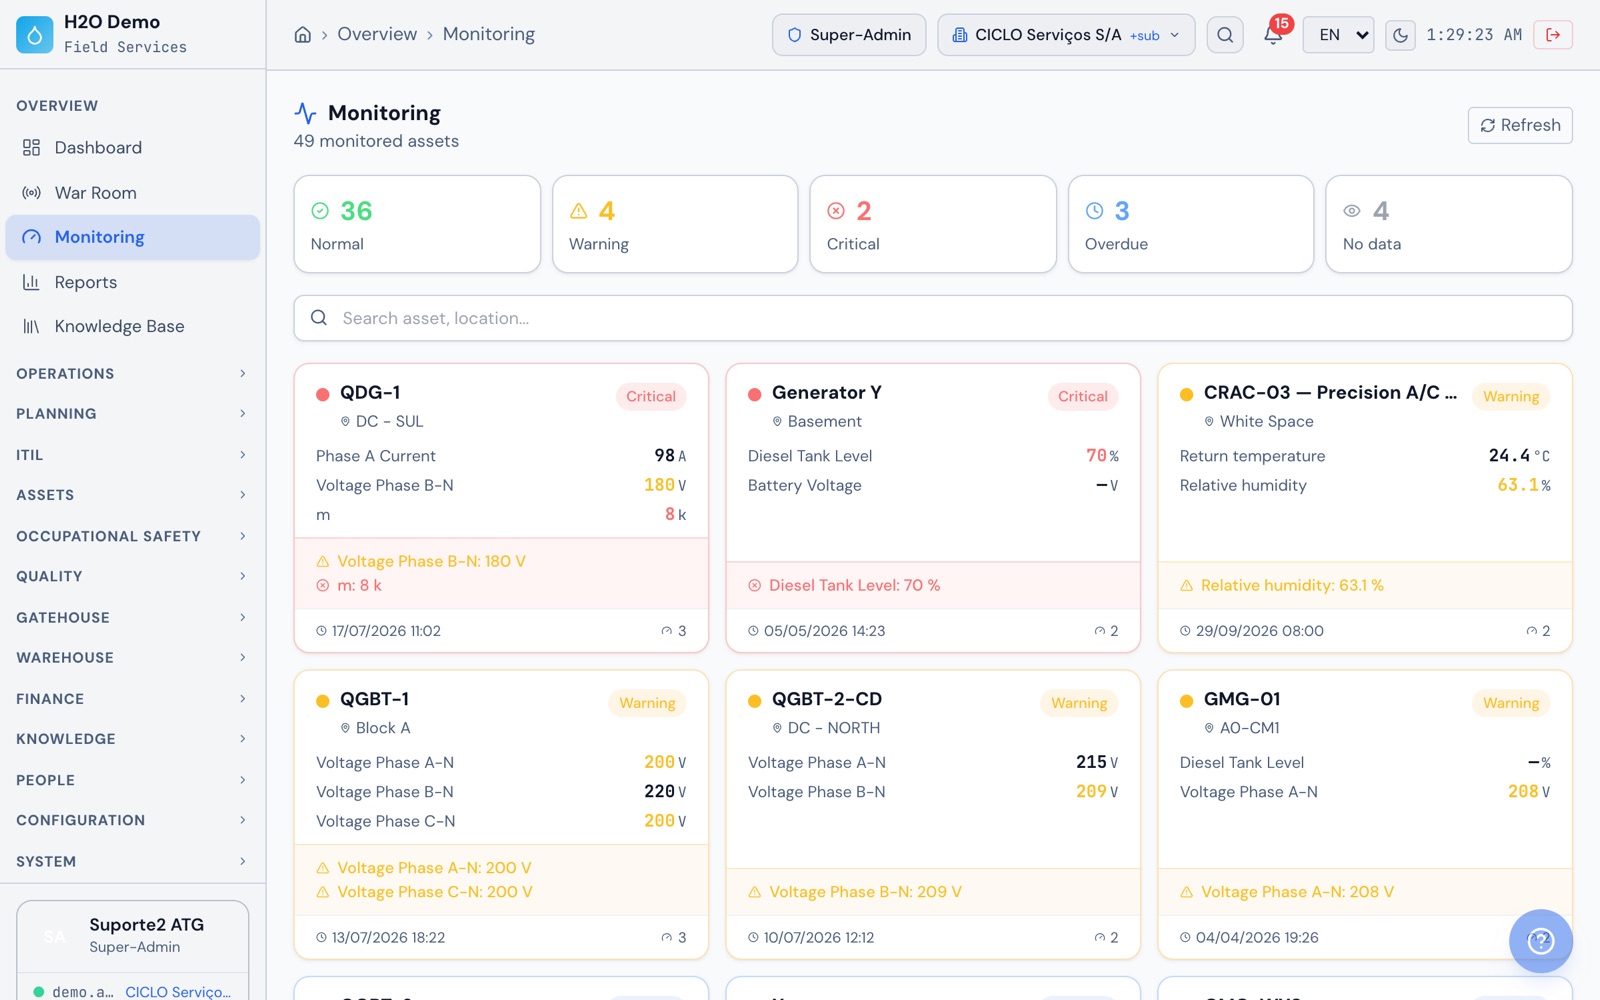
At the officeOn the web, the Monitoring dashboard with totals by status and the cards for the chiller, switchboards and generators in Critical or Attention, with the latest readings.
Overview › Monitoring
H2O web: the Monitoring dashboard with totals by status and the cards for the chiller, switchboards and generators in Critical or Attention, with the latest readings.
Diagrams

Dependency diagram with impact analysis

Draw the power and cooling chain with your registered assets and symbols for transformer, main switchboard, generator, UPS, ATS, busbar, chiller and rack. Connect the blocks with Feeds, Protects, Monitors and Depends. Click an asset to see what is affected downstream, upstream or both ways.

  • Each block shows status, location, open tickets, MTBF/MTTR, next preventive job and latest measurements
  • Attention or critical highlight on the block based on the measurements
  • The analysis considers every connection saved on the assets, including those made in other drawings
  • Diagram export to PNG
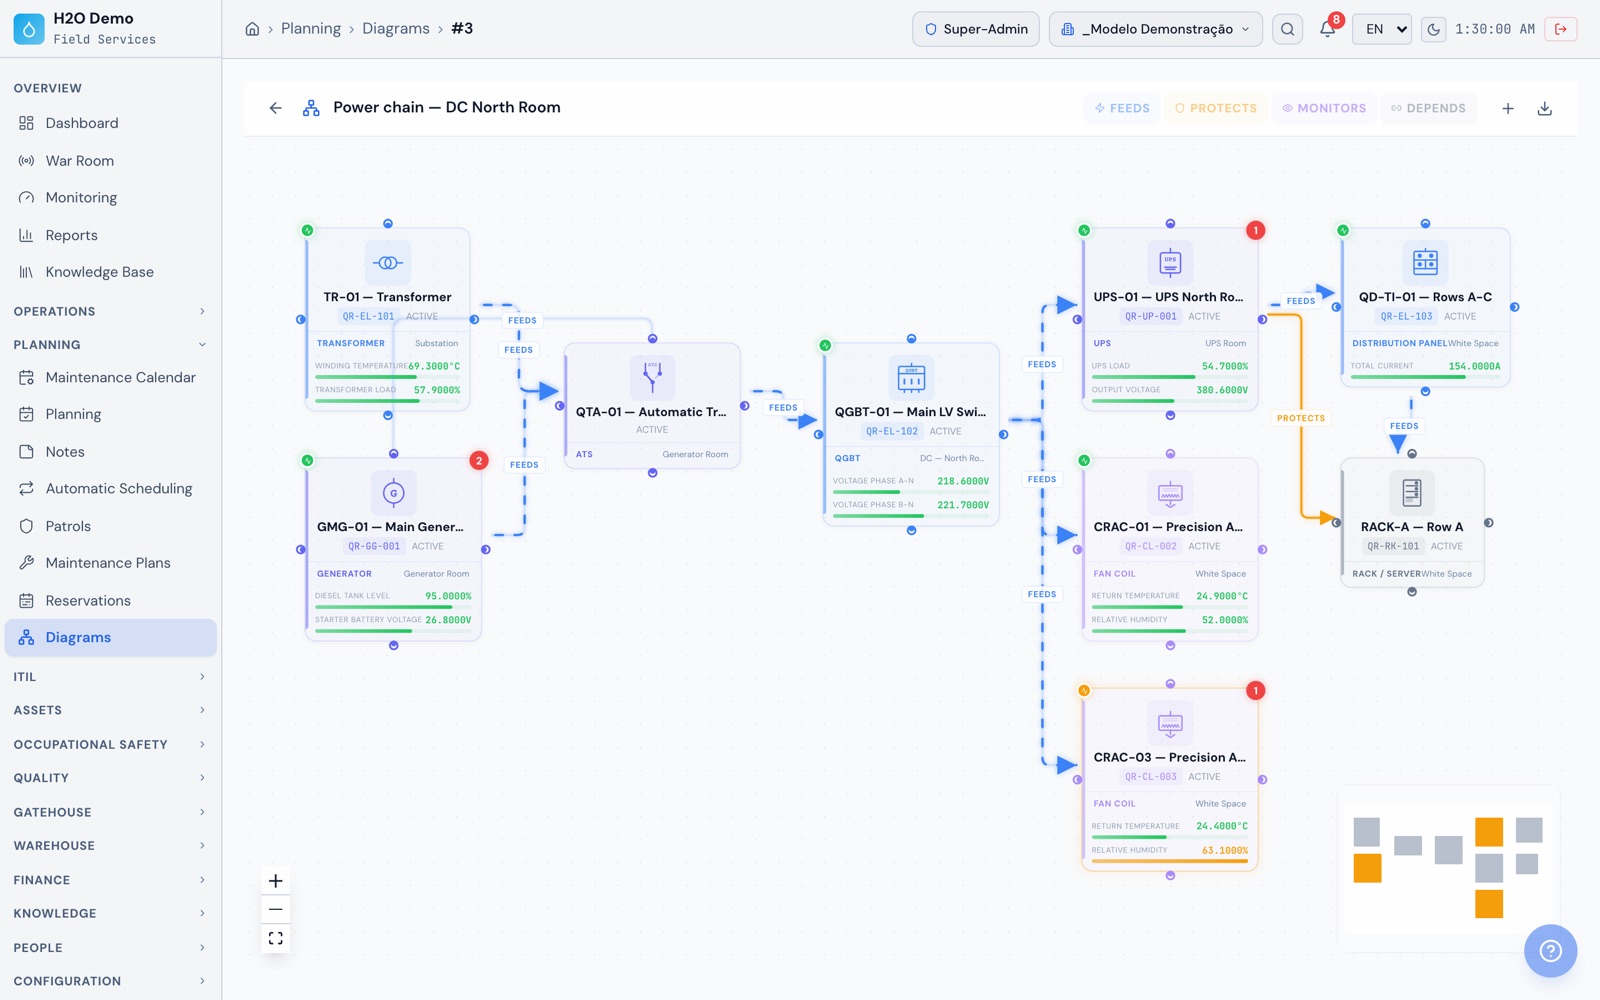
At the officeOn the web, the data center electrical chain: transformer and generator on the ATS, main switchboard, UPS, CRACs, IT panel and a row of racks, connected by Feeds and Protects, with the latest readings of the blocks that have measurements.
Planning › Diagrams
H2O web: the data center electrical chain: transformer and generator on the ATS, main switchboard, UPS, CRACs, IT panel and a row of racks, connected by Feeds and Protects, with the latest readings of the blocks that have measurements.
Dashboard and KPIs

Preventive maintenance dashboard and reliability per asset

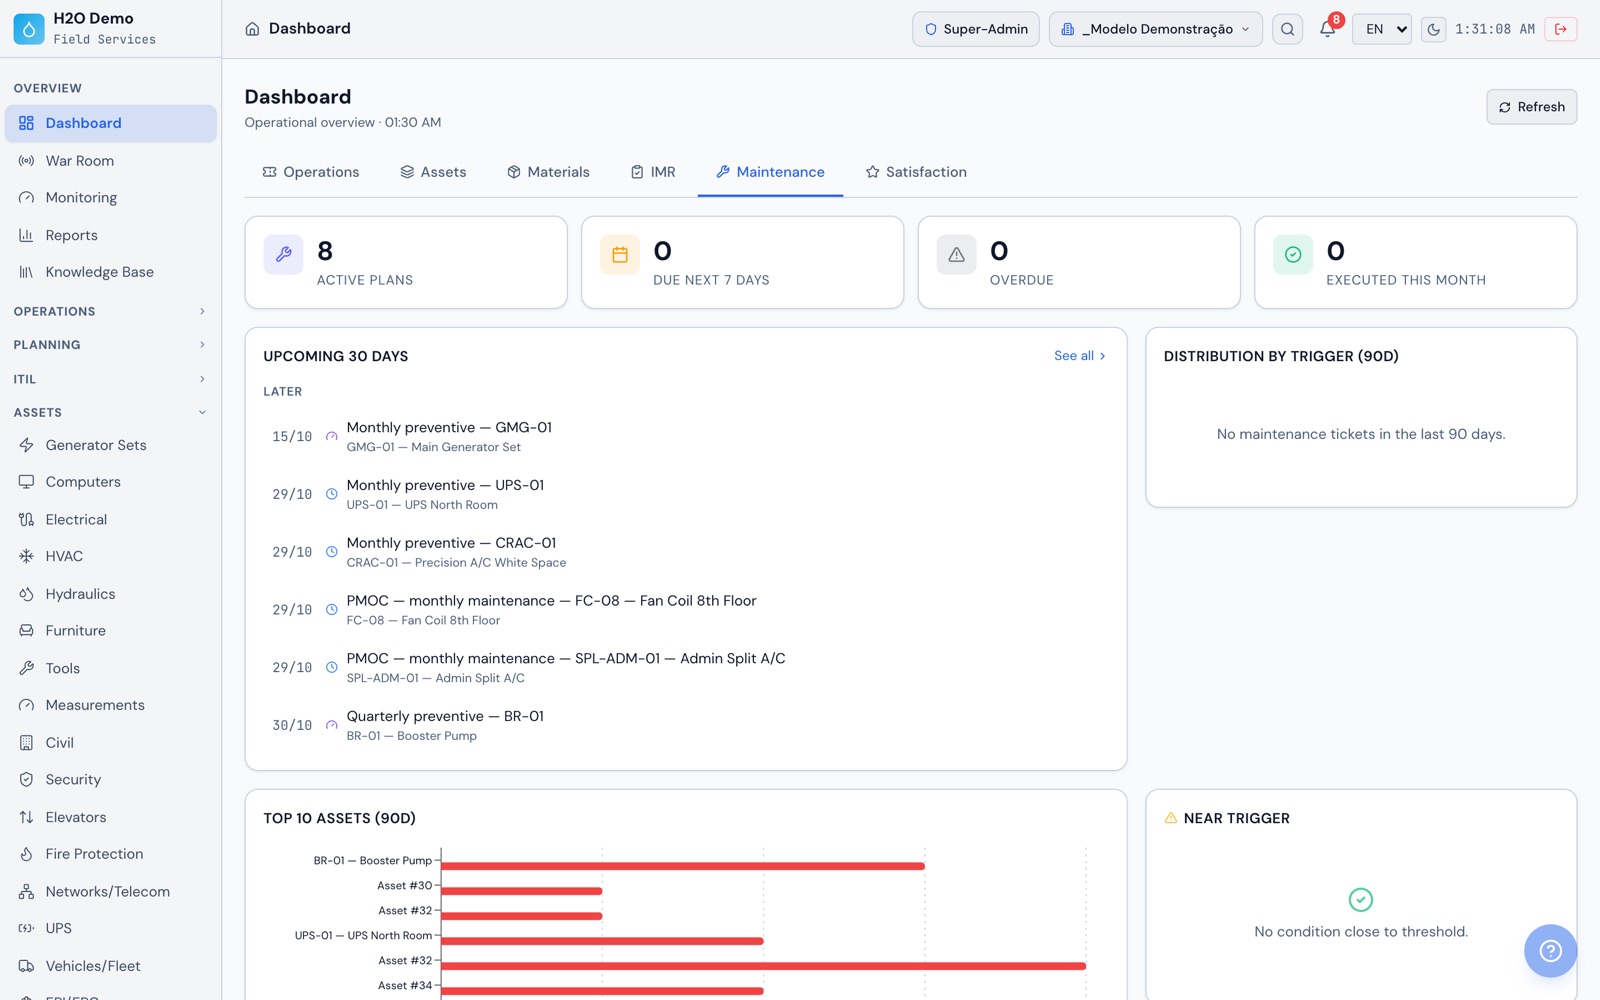
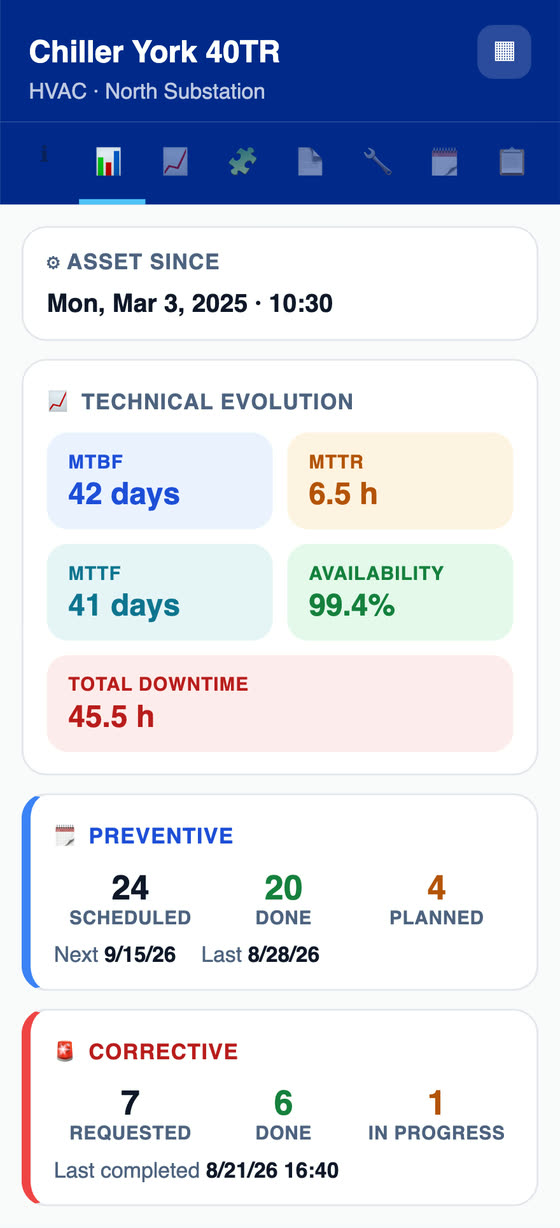
On the Maintenance tab of the Dashboard, see active plans, plans due in the next 7 days, late plans and plan work orders completed this month. In the asset statistics, H2O separates preventive and corrective work by the work order modality and calculates MTBF, MTTR, MTTF, availability and downtime.

  • List of what is due in the next 30 days and what is already late, with plan, asset, checklist, trigger type and technician
  • Work orders generated by trigger type and the top 10 assets with preventive and corrective work, over the last 90 days
  • Conditions already past the limit that have not yet reached the number of days the plan requires
  • Reliability report for all assets by period, in PDF
On the phoneIn the app, the asset's MTBF, MTTR, MTTF and availability, with preventive and corrective work counted from the work orders.
At the officeOn the web, the Maintenance tab with active plans, what is due in the next 7 days, late plans, those completed this month and the 30-day list.
Overview › Dashboard › Maintenance
H2O web: the Maintenance tab with active plans, what is due in the next 7 days, late plans, those completed this month and the 30-day list.
H2O app: the asset's MTBF, MTTR, MTTF and availability, with preventive and corrective work counted from the work orders.
Audit

Evidence of every intervention, ready for the audit

Checklists with a required photo per item, annotated photos, GPS on each answer from the app and technician and client signatures on screen. If the template is set to generate non-conformances, non-compliant items become an NCR when the task is completed, and the NCR opens a ticket linked to the originating work order.

  • Plan, generated work order, execution and history linked to the same asset
  • Checklist audits with compliant, partial, non-compliant or not applicable answers, and photos or PDF per item
  • Statistics by group, progress between audits and a PDF report sent by email
  • Change log per record and per user: who changed what and when
  • Two-step verification and profiles limited to the allowed sites
On the phoneIn the app, the audit with the session plan, audited sectors and findings with evidence photos.
At the officeOn the web, the audit with compliance by group, evidence photos and the PDF report.
Why H2O

Also in H2O for mission-critical operations

Changes with a rollback plan

Record the change with impact analysis, implementation plan, rollback plan, affected assets and approval before the maintenance window.

Calibrated instruments on the work order

Thermal camera, insulation tester and clamp meter with calibration interval, certificate in PDF, valid, due soon or expired status, and a link to the work order where they were used.

Tickets from the equipment QR code

The client's operator scans the QR code on the UPS or rack and opens a ticket without logging in, with up to 5 photos. The ticket is linked to the asset from the start.

Spare parts

Batteries, filters and fuses with stock in and out, minimum stock, a list of what is below the minimum and material requests with approval, opened from the ticket in the app.

Work permits and JHA alongside operations

Work Permit (PT) with checklist and signatures, Job Hazard Analysis (APR) acknowledged by the team, daily safety talks, trainings and PPE records in the same system as the work orders.

Reports for the client

Executive report and contract management report in PDF and PowerPoint, SLA and reliability reports, and batch sending of RATs and checklists in a single PDF with cover and index.

SLA and War Room

Response and resolution deadlines, with a business hours calendar and pausing on waiting statuses. In the NOC, the War Room shows tickets by priority, sites on the map and the technicians' last known location.

AI to build checklists

Describe the inspection in text and get a checklist template with items, answer types and frequency, in Portuguese with an English translation.

Three languages

Web and app in Portuguese, English and Spanish. The app generates checklist and RAT PDFs in all three languages.

Get the app

The same H2O in the technical room, the NOC and planning

Technicians on the phone, even in a basement with no signal. Planning, NOC and management on Windows or in the browser. The same data and the same offline queue.

Android
Phones and tablets · Google Play
Open on Google Play
iPhone and iPad
iOS · App Store
Open on the App Store
Windows
Desktop and kiosk · Microsoft Store
Install from Microsoft Store
Free trial

Try H2O right now

Enter your name and email and get instant access to a demo environment with sample data, on the web and in the app. The data is reset every 72 hours.

Create your exclusive demo environment in seconds.

This will be your site name in H2O. You can use a fictional name.

No commitment · 7-day access · Your data will not be shared

Frequently asked questions

What people usually ask before starting

How does the preventive maintenance plan work in H2O?

Each plan links an asset to a checklist template and to one or more triggers: time (every N days), usage (every X hour meter hours, with the projected date calculated from average consumption) and condition (when a metric reading crosses its limit, with the option to require N days in a row out of range). Whichever comes due first wins. Once a day H2O recalculates the next date and, within the lead time you set, opens the work order with checklist, technician and group, by default only for assets in operation. When the work order is solved or closed, the plan restarts the count. Usage and condition triggers need a metric set up on the asset, such as the hour meter, and readings for it.

What is the difference between a maintenance plan and the annual schedule?

A plan follows one asset and opens one work order at a time, when the trigger that comes due first is getting close. It works well for a generator by hour meter or a CRAC by reading. The schedule generates all the work orders for a period at once for several assets, using the checklist template's frequency, from daily to yearly or every N days, with dates moved to the nearest business day and estimated hours. It fits the annual schedule you present to the client. Both show up on the Maintenance Calendar, and the next preventive job of each plan appears there before the work order exists.

How do I track what is coming due, what is late and what has been done?

On the Maintenance tab of the Dashboard: active plans, plans due in the next 7 days broken down by trigger type, late plans and plan work orders completed this month. Below that, the list of what is due in 30 days and what is already late, with plan, asset, checklist, trigger type and technician, the work orders generated by trigger type over the last 90 days, the top 10 assets with preventive and corrective work, and the conditions already past the limit that have not yet reached the required number of days. The dashboard shows only the sites the user's profile can see.

How does H2O calculate MTBF, MTTR and availability?

Per asset, from the work orders linked to it and the modality of each one. On the web, MTBF is the average interval between the openings of corrective work orders, and MTTR is the average time between their opening and their solution. Availability subtracts the downtime of corrective work from the time since the asset was registered. The same tab shows MTTF and downtime, with a timeline of preventive and corrective work. For the numbers to be right, each work order has to be linked to the asset and have the right modality, preventive or corrective. An automation rule can set the modality when the work order is opened, including work orders generated by plans. The reliability report brings these KPIs together for all assets by period, in PDF.

How does H2O track components such as batteries, filters and compressors?

Each component is linked to the asset, with an installation date and a lifespan by time, by usage (hours entered on the component) or whichever comes first. The asset shows whether the component is on time, due soon or expired, and keeps the history of every replacement. Component status also appears on the RAT (service report), the checklist and the technical report. A replacement restarts the count, and H2O emails the people you choose when the component becomes due soon or expired.

Is H2O an Uptime Institute partner?

No. ATG has no partnership with Uptime Institute, and H2O is not certified or endorsed by it. H2O was born inside mission-critical data centers and was used as the maintenance management tool in Uptime Institute® Operational Sustainability audit processes. What it keeps are the records the operation uses to show its maintenance program: the plan, the completed work orders with checklist, photos and signature, and the history of each asset. Using H2O does not guarantee certification or any audit result.

Does H2O help prepare for operations and maintenance audits?

It helps bring the evidence together in one place: maintenance plans and schedules, completed work orders with checklists, required photo per item, GPS on each answer from the app, technician and client signatures on screen, a PDF of each execution, asset history, a log of who changed what and when, instruments with their calibration certificate attached, and checklist audits where a non-compliant item can become an NCR with a ticket linked to the work order. The audit criteria and preparation remain with your team.

How do shift patrols work in H2O?

You create the patrol from a checklist template where each item points to an asset, with daily, weekly, monthly or on-demand frequency, technician and time. The patrol work order is opened by the daily routine or on the spot with the Execute button. In the app or on the web, the technician marks Done, Not done or NA and enters the readings for each piece of equipment, such as the three-phase voltage of the main switchboard. An out-of-range reading is flagged in the asset history and evaluated by the condition trigger of any plan that uses that metric. For patrols per shift, set up one patrol for each shift.

What happens when a reading goes out of range?

The reading is classified as low, high, critical low or critical high and is highlighted on the asset chart, with the limit lines. On the Monitoring dashboard, the asset moves to Attention or Critical, and anything without a reading on time shows as Late. If a plan has a condition trigger on that metric, it counts toward opening the preventive job at the daily check. In a checklist, a numeric item outside the tolerance becomes non-compliant and, if the template is set to generate non-conformances, becomes an NCR with a ticket linked to the work order.

Does the app work in basements and electrical rooms without signal?

Yes. Field work runs offline: tickets, preventive checklists, patrols, switchboard, UPS and thermography inspections, readings, annotated photos, signatures, opening the asset by QR code and the checklist PDF on the device. When the connection comes back, everything syncs. Login and the first sync need a network connection. Plans, schedules, diagrams, dashboards and the full technical report are set up on the web.

How does H2O handle UPS, generators and the ATS?

Each piece of equipment is an asset with its own fields. For the UPS: kVA, input and output voltages, runtime, number of batteries, battery replacement date and topology. For the generator: voltage, current, power, frequency, phases and engine data. The battery bank is set up as a component with a lifespan by time or by usage. The generator test is a configurable checklist, with a tolerance range on each measurement, photos and signature, and it can have its own plan by date or by hour meter. Transfer time, if you want to record it, goes in as a numeric item in the template. On the web, the generator technical report in PDF includes the diagram of the ATS automatic transfer sequence.

How does H2O measure SLA and availability?

It measures the ticket service SLA: response deadline and resolution deadline, with a business hours calendar. The SLA is set on the ticket manually, by rule or by the site's active contract, with deadlines by priority. Waiting statuses, such as waiting for parts, can pause the resolution deadline. SLA reports show a summary and trends, and a filter lists tickets with a breached SLA. Availability is calculated per asset from the work orders, and the reliability report brings these numbers together by period.

Can H2O receive readings from a BMS or SCADA system?

There is a REST API for readings: a gateway, SCADA system or script sends the values identifying the asset (by id or by an external reference registered on it) and the metric. Authentication uses a user's token, and the metric must be set up on the asset. Readings go through the same range classification and feed charts, the dashboard and the plans' condition triggers. Each SCADA system is connected through an integration project with this API.

Put your data center maintenance plan in H2O

Create your demo environment in seconds, with sample data on the web and in the app, and set up a preventive plan for an asset. For a guided walkthrough with a data center scenario, message the team on WhatsApp.